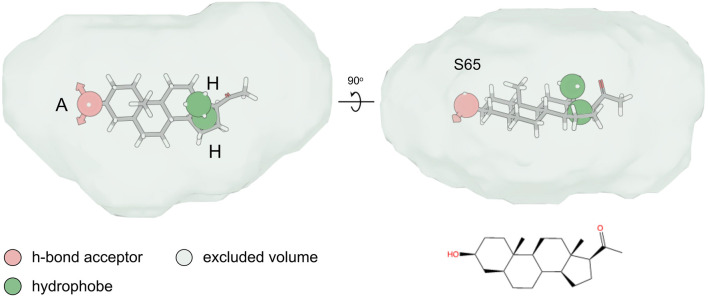
FIGURE 8.
Pharmacophore hypothesis. Top and side view of the fitting of compound S65 into the pharmacophore hypothesis depicting the minimum pharmacophore features that a ligand needs to satisfy for it to interact non-covalently with its receptor. The hydrogen-bond acceptor (“A”) and hydrophobe (“H”) pharmacophore features are shown as spheres, while the excluded volume that was considered based on the shape of the agonist compounds is shown as a surface.

