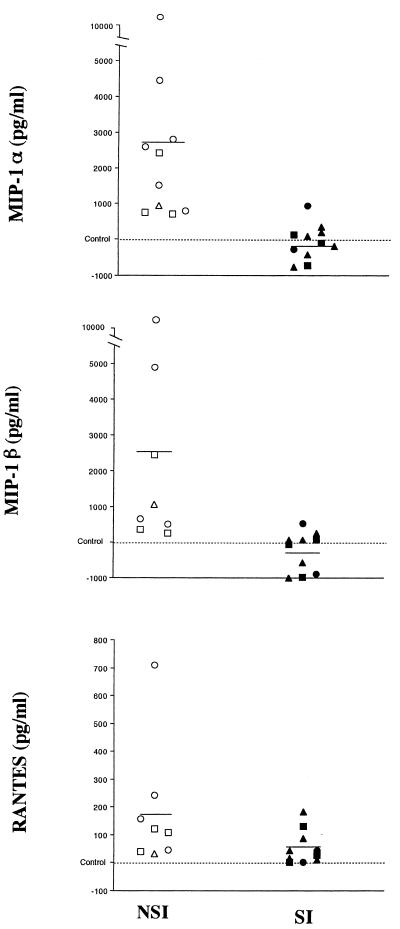
FIG. 2.
Relative variation in β-chemokine production by HIV-1-infected CD4+ T cells versus the uninfected controls. The differences among the levels of MIP-1α, MIP-1β, and RANTES produced by CD4+ T cells infected with several viral isolates (NSI, SV [○], NB [□], and LSP [▵]; SI, KP [▴], EM [■], and SF2 [•]) and their concurrent control cultures (uninfected cells from the same donors) are shown. Cells from seven different donors were used. Purified CD4+ T cells were stimulated for 3 days with 3 μg of PHA per ml, washed, and subsequently infected with various NSI and SI virus strains and cultured as described in Materials and Methods. Each symbol represents results with the virus in a separate experiment. The concentration of chemokines in the cell culture fluids was measured by ELISA in duplicate (Quantikine; R&D Systems). The levels of chemokines measured in culture fluids from day 13 are shown (one measurement from day 11 of cells plated at 106 on day 8 is included) in reference to the level in the control cultures. Control level ranges (picograms per milliliter): MIP-1α, 58 to 4,261; MIP-1β, 46 to 1,117; RANTES, undetectable to 38. All results are adjusted per 106 viable cells. Cell numbers (106) on day 13: control (n = 6), 1.2 ± 0.21; NSI (n = 8), 0.93 ± 0.24; SI (n = 9), 0.67 ± 0.17. Compared to control cultures, NSI viruses increased MIP-1α and MIP-1β production significantly (P < 0.01); both NSI and SI viruses increased RANTES production significantly (P < 0.01) (Wilcoxon signed-rank test).

