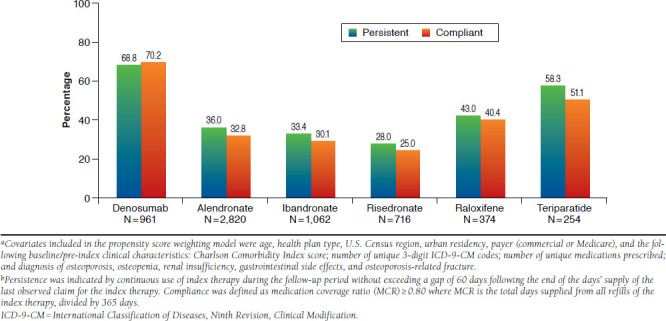
FIGURE 3.

Propensity Score Weight-Adjusted Rates of Persistence and Compliance with Osteoporosis Therapies During 12-Month Follow-up, Women Aged 50 Years and Older at High Risk for Fracturea,b

Propensity Score Weight-Adjusted Rates of Persistence and Compliance with Osteoporosis Therapies During 12-Month Follow-up, Women Aged 50 Years and Older at High Risk for Fracturea,b