Figure 1.
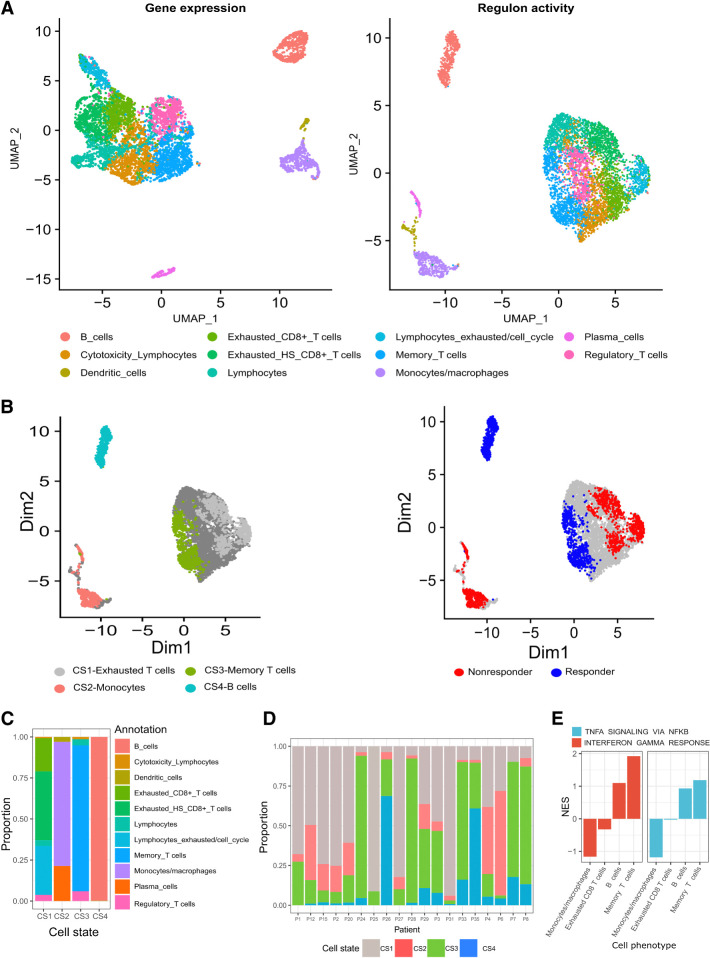
Analysis of scRNA-seq data from samples taken from 19 patients with melanoma before ICI therapy (GSE120575; ref. 8). A, Dimensionality reduction, clustering and UMAP projection of tumor-resident immune cells. Left, Clustering according to gene expression profiles. Right, Clustering according to regulon activity profiles. B, UMAP embeddings of pretreatment cells, annotated on the basis of DAseq identified cell states (left), and their association with response (right). C, Distribution of immune cell phenotypes in the four DAseq identified cell states. D, The proportion of the DAseq identified cell states in each patient sample. E, The normalized enrichment scores (NES) of IFNG and TNFA pathways according to DEGs between cells from a cell phenotype (x-axis labels) that are either included or excluded from their associated DAseq cell state. Scores were calculated using GSEA.

