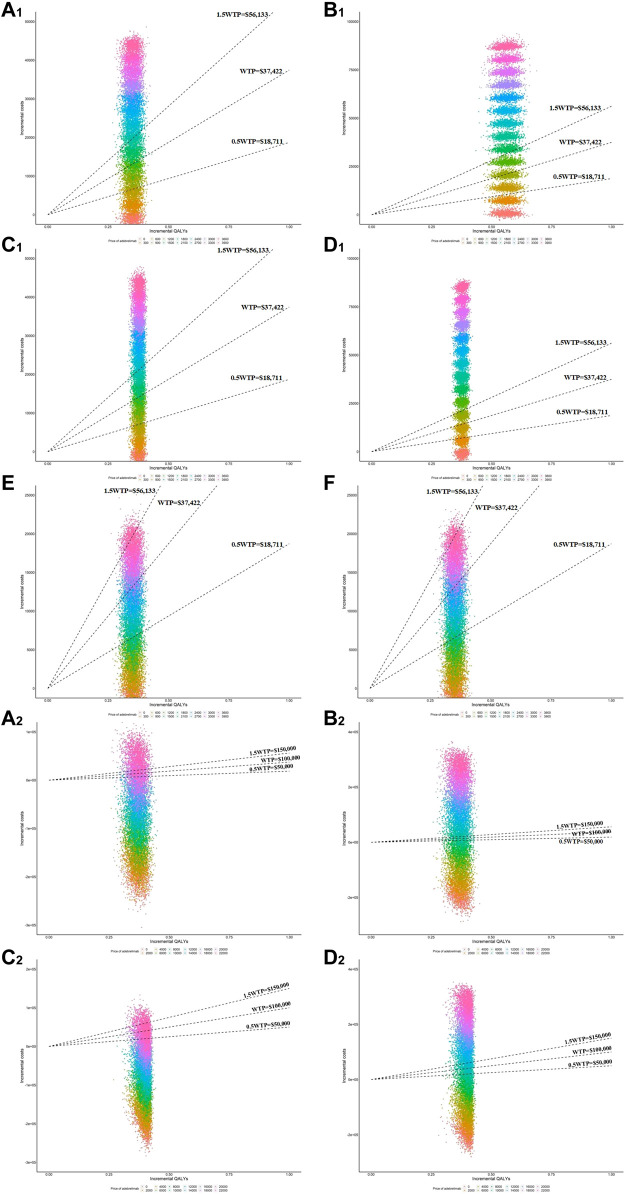
FIGURE 3.
Scatter plots of incremental QALYs and costs in the PSA at various adebrelimab prices. (A1) Results of PSA in model 1 for base-case from Chinese perspective (B1) Results of PSA in model 2 for base-case from Chinese perspective, (C1) Results of PSA in model 1 for scenario 1 from Chinese perspective (D1) Results of PSA in model 2 for scenario 1 from Chinese perspective, (E) Results of PSA in model 1 for scenario 2 from Chinese perspective (F) Results of OWSA in model 2 for scenario 2 from Chinese perspective. (A2) Results of PSA in model 1 for base-case from the US perspective (B2) Results of PSA in model 2 for base-case from the US perspective, (C2) Results of PSA in model 1 for scenario 1 from the US perspective (D2) Results of PSA in model 2 for scenario 1 from the US perspective.

