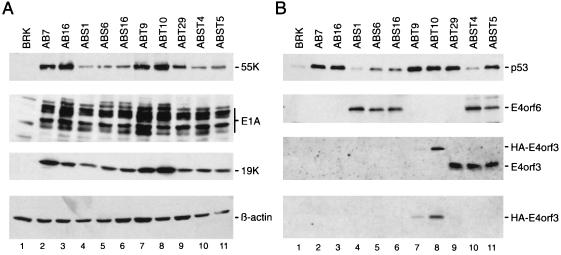
FIG. 3.
Protein analysis of selected AB, ABS, ABT, and ABST cells. (A) The same amount of whole-cell extract was separated on SDS–10% polyacrylamide gels and transferred to a nitrocellulose filter by Western blotting. The same filter was then subsequently probed with anti-E1B-55kDa MAb 2A6, anti-E1A antibody M73, and anti-E1B-19kDa antibody 1G11 followed by enhanced chemiluminescence. Quantitative loading of proteins was determined by probing the filter with the anti-β-actin antibody AC-15. (B) Equal amounts of total cell extracts were subjected to immunoprecipitation using anti-p53 MAb PAb421, anti-E4orf6 MAb RSA3, anti-E4orf3 MAb 6A11, or anti-HA antibody 12CA5. The precipitates were resolved on 10 to 15% protein gels and transferred to nitrocellulose membranes. The p53 and E4orf6 proteins were visualized with antibodies CM-1 and RSA3, respectively, followed by enhanced chemiluminescence. Native E4orf3 and HA-tagged E4orf3 were detected with MAb 6A11 and the HA-specific antibody 12CA5, respectively.

