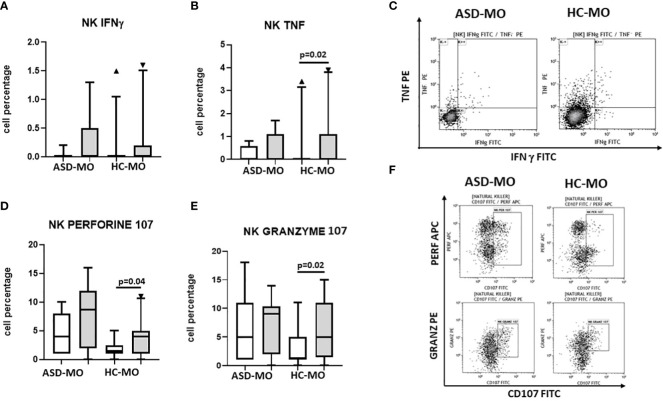
Figure 6.
NK functionality. INFγ (A), TNF (B), CD107a+/perforin+ (C), and CD107a+/granzymes+ (D) NK cells. Cells were either unstimulated (white box) or were stimulated with SEB+ anti-CD28 (grey box). Results obtained in mothers of children who developed (ASD-MO) and mothers of healthy children (HC-MO) are shown. Boxes stretch from the 10th to the 90th percentile. Lines across the boxes indicate the median values. Lines stretching from the boxes indicate extreme values. Statistical significance is shown. Representative dot plots of TNF vs. IFN-γ producing NK cells (E) or of granzyme vs. CD107 and of perforin vs. CD107 (F) obtained from ASD-MO or HC-MO. ▲, represent outside values.

