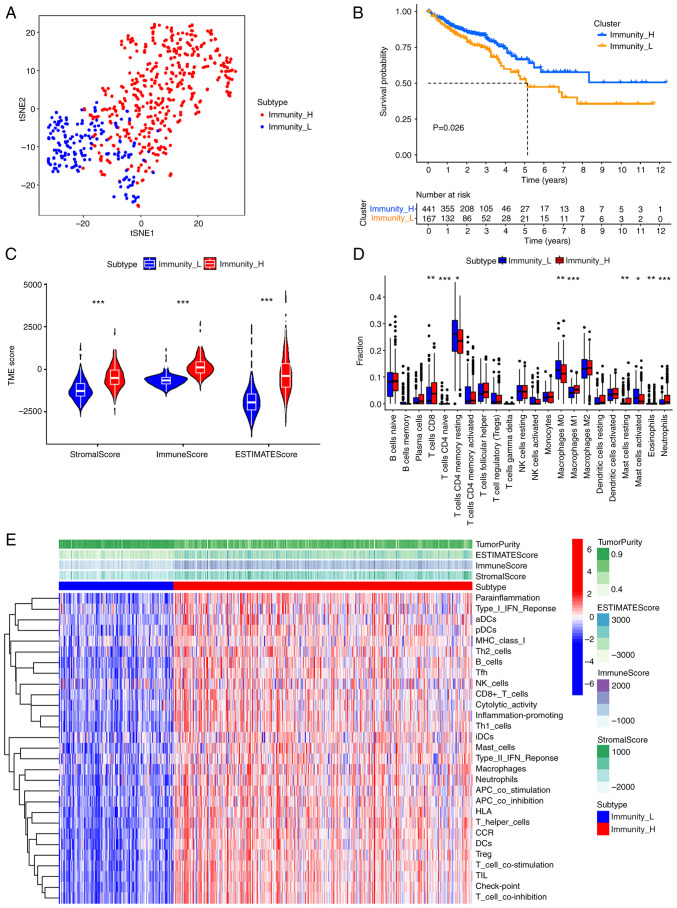
Figure 1.
Classification immune landscape of high- and low-immunity groups in colorectal cancer. (A) The distribution of colorectal patients in high- and low-immunity groups. (B) The Kaplan-Meier curves predict the overall survival in the high- and low-immunity groups. (C) The immune scores, stromal scores and ESTIMATE scores for the high- and low-immunity groups. (D) Distribution of 22 types of immune cells in the high- and low-immunity groups. (E) Heatmap of ESTIMATE scores and immune gene sets for high- and low-immunity groups. *P<0.05, **P<0.01 and ***P<0.001. tSNE, T-distributed stochastic neighbor embedding; TME, tumor microenvironment; H, high; L, low; CD, cluster of differentiation; NK, natural killer; aDCs, activated dendritic cell; pDCs, plasmacytoid dendritic cell; Th, helper T cells; Tfh, follicular helper T cells; iDCs, immature dendritic cells; APC, antigen-presenting cell; HLA, human leukocyte antigen; CCR, chemokine receptor; DCs, dendritic cell; TIL, tumor infiltrating lymphocyte.

