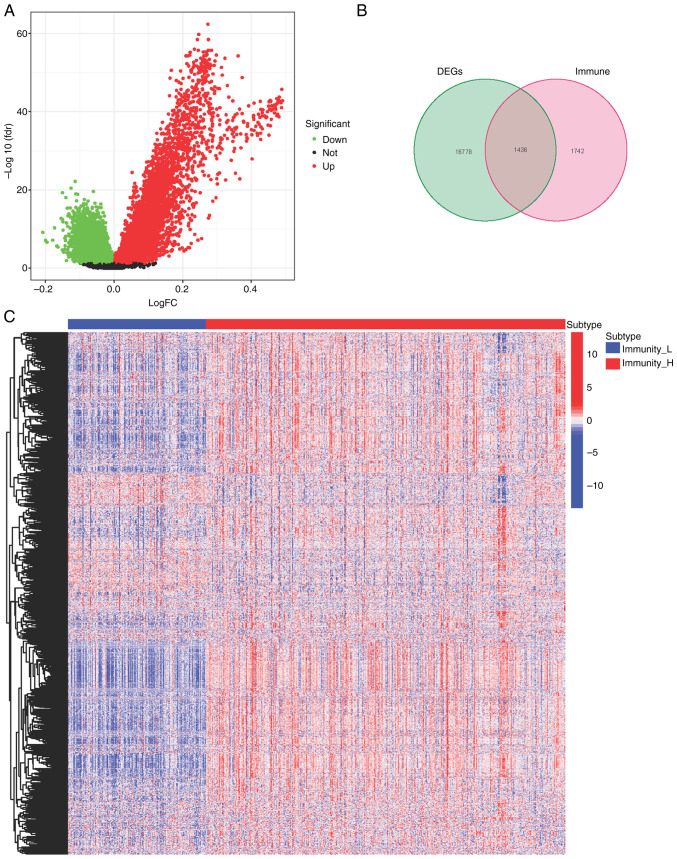
Figure 2.
Evaluation of DEGs in the high- and low-immunity groups. (A) Volcano plot and (B) Venn of the DEGs in the high- and low-immune groups and immune-related genes from ImmPort and innateDB databases. (C) Heatmap of the 1195 upregulated genes and 241 downregulated genes. DEGs, differentially expressed genes; H, high; L, low.

