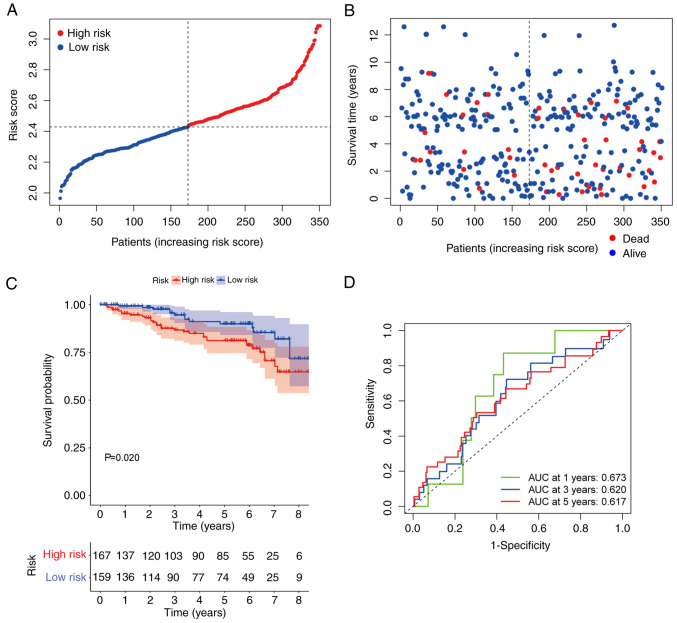
Figure 4.
Validation of the risk signature. (A and B) Mortality rate was associated with high risk scores. (C) The validation cohort demonstrated distinctly different survival curves between the high- and low-risk groups. (D) Receiver operating characteristic curves predicted the risk model efficiency in the validation cohort. AUC, area under the curve.

