Figure 7.

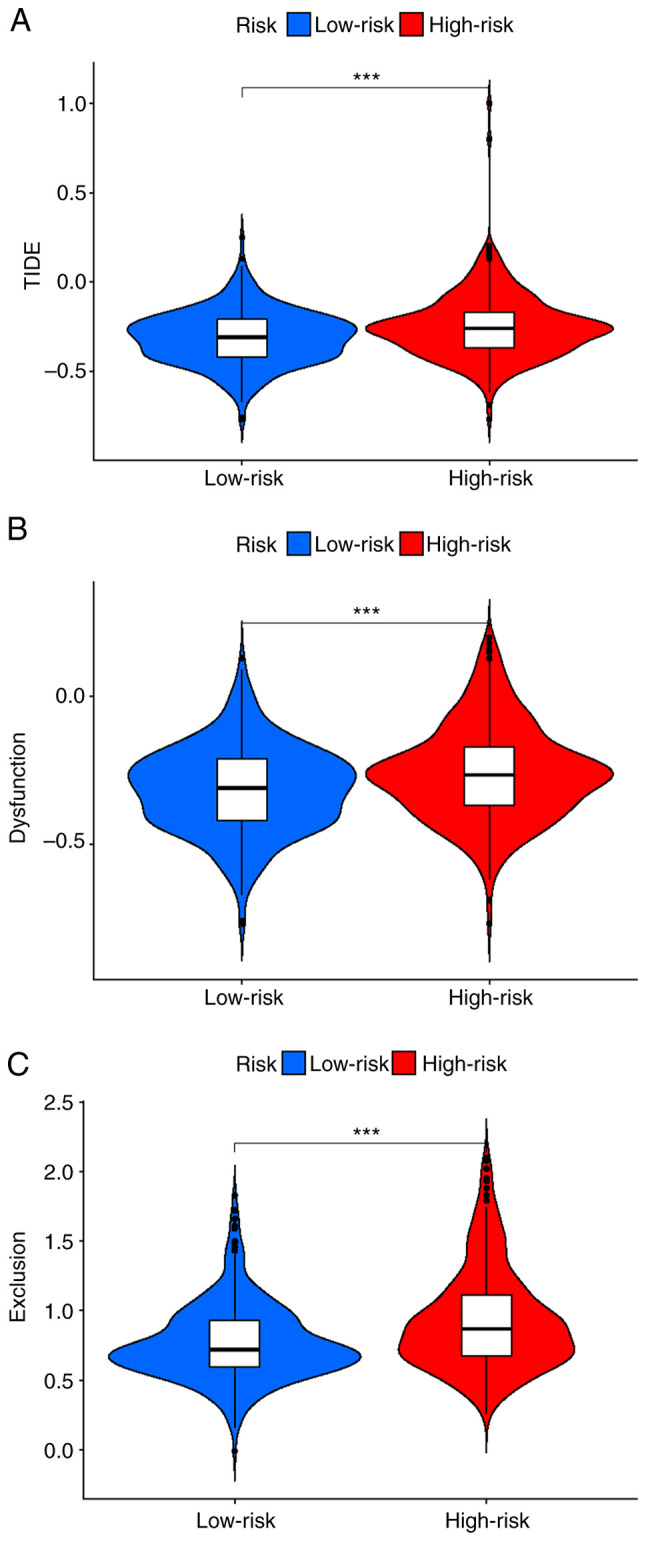
Prediction of immune checkpoint blockade responses in the high- and low-risk groups. (A) TIDE score, (B) dysfunction score and (C) exclusion score in the high- and low-risk groups. ***P<0.001.

Prediction of immune checkpoint blockade responses in the high- and low-risk groups. (A) TIDE score, (B) dysfunction score and (C) exclusion score in the high- and low-risk groups. ***P<0.001.