
Figure 1. Exhaustive AlphaFold2‐Multimer prediction of pairwise protein–protein interactions within the 53BP1‐RIF1‐shieldin‐CST pathway.
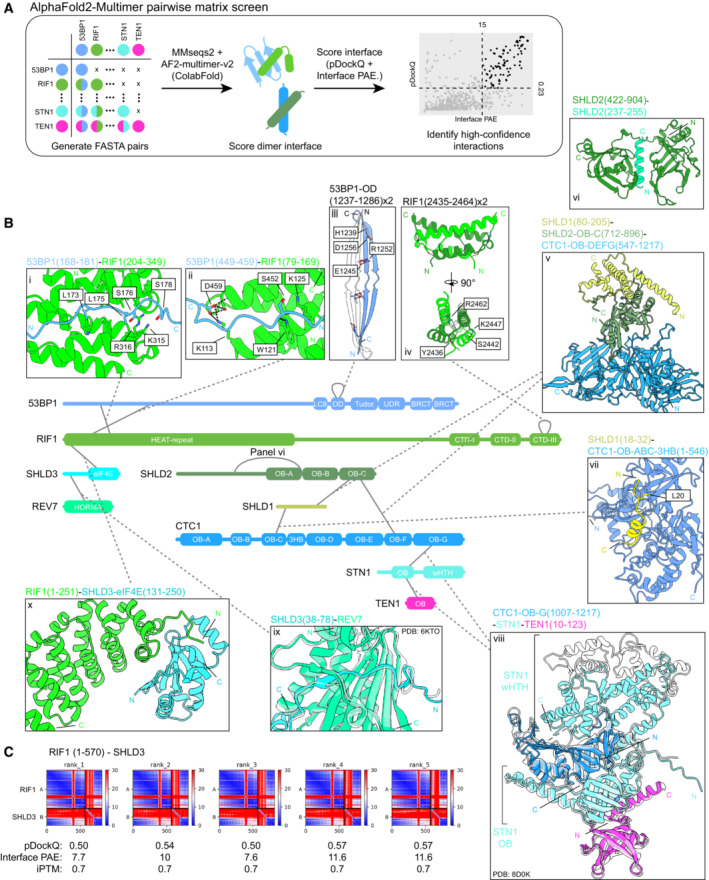
- Schematic of the AF2 pairwise matrix screen for protein–protein interactions within the 53BP1‐RIF1‐shieldin‐CST pathway. Scatter plot of the interface‐predicted aligned error (PAE) vs pDockQ scores for the models predicted in this analysis is shown, along with the cutoff values of 15 Å and 0.23 for PAE and pDockQ, respectively. Models meeting the cutoff are represented as black points and those that do not are represented as gray points.
- High‐confidence interactions predicted by AF2. Structures of interfaces are shown, with corresponding experimental structures overlaid (translucent) if available (CST complex and SHLD3‐REV7; PDB ID: 8D0K, 6KTO). Modeled hydrogen bonds and salt bridges are shown as black and red dashed lines, respectively. See also Fig EV1.
- PAE plots of RIF1 (1–570) and SHLD3, with calculated pDockQ, interface PAE, and interface‐predicted template modeling (iPTM) scores.
Source data are available online for this figure.