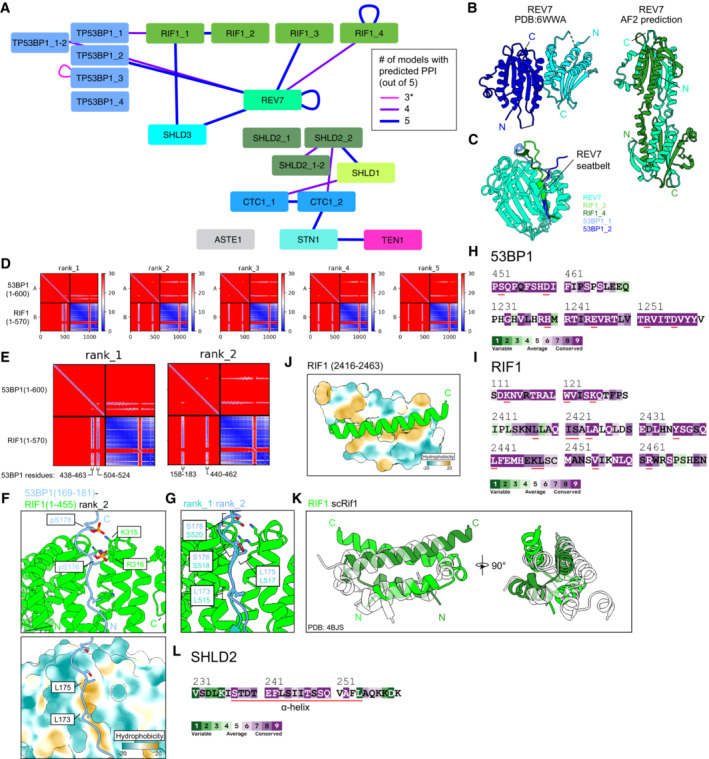
Schematic of predictions that meet the cutoff scores of pDockQ > 0.23, interface PAE < 15 Å, and four or more repeated predictions. Nodes are proteins and fragments used for each prediction. Junction nodes are fragments spanning ± 200 residues from where large proteins are divided and are only shown if interactions meeting the score cutoffs are present (e.g., TP53BP1_1‐2). Edges link the two chains used for each prediction. Edge thickness and color correspond to the number of predictions (out of five for each pair) meeting the score cutoffs. *Self‐association of TP53BP1_3 is shown despite not meeting the ≥ 4 consistent model cutoff due to previous experimental results corroborating the predicted interaction.
Comparison of REV7 dimer structures determined from X‐ray crystallography (Left, PDB ID: 6WWA) and from AlphaFold2 prediction (right).
Superimposition of predicted heterodimeric structures between REV7 and RIF1 fragments 3 and 4 and 53BP1 fragments 1 and 2. See also Appendix Fig
S1.
PAE plots of the predicted 53BP1 (fragment 1; 1–600) and RIF1 (fragment 1; 1–570), ranked by predicted template model (pTM) scores.
Close‐ups of two PAE plots from (D), with the 53BP1 regions of high PAE confidence labeled.
Predicted structures of the 53BP1‐RIF1 interface. Top, phosphate groups modeled onto two serines of 53BP1 whose phosphorylation is known to be essential for interaction with RIF1. Bottom, surface representation of RIF1 colored by hydrophobicity.
Superimposition of the 53BP1‐RIF1 interface from two different predicted models.
ConSurf sequence conservation analysis of the indicated 53BP1 regions. Residues important for the predicted secondary RIF1‐53BP1 interface (53BP1 residues 440–462) or 53BP1 oligomerization (53BP1 residues 1,237–1,286) are underlined in red.
ConSurf sequence conservation analysis of the indicated RIF1 regions. Residues important for the predicted RIF1 oligomerization (RIF1 residues 2,435–2,464) or the predicted secondary RIF1‐53BP1 interface (RIF1 residues 79–169) are underlined in red.
Predicted structure of the RIF1 dimerization interface, one monomer is shown with surface representation colored by hydrophobicity.
Superimposition of the RIF1 oligomerization domain and the experimentally‐determined structure (translucent) of the corresponding region in S. cerevisiae Rif1 (PDB ID: 4BJS).
ConSurf sequence conservation analysis of the indicated SHLD2 region. Residues comprising the alpha helix predicted to bind SHLD2 OB‐A and OB‐B are underlined in red.

