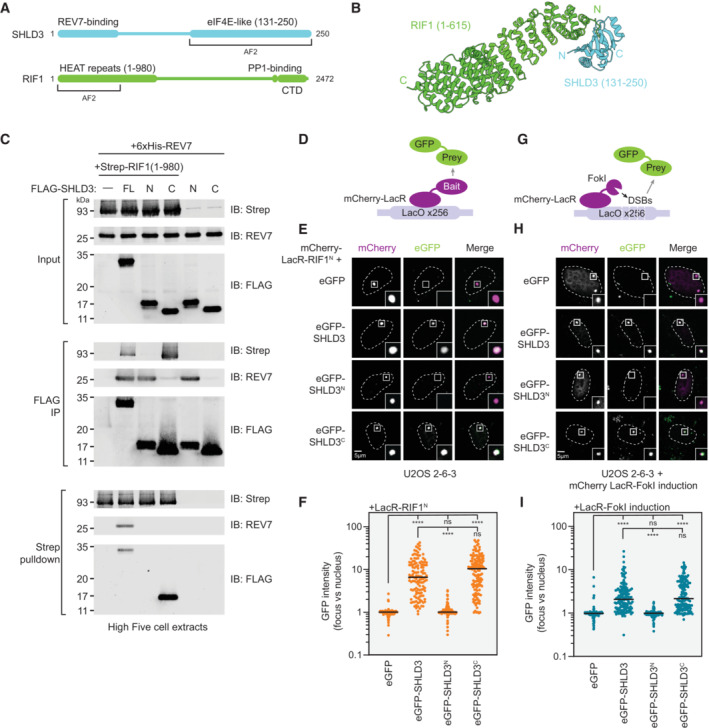
Figure 2. The RIF1 N‐terminal HEAT repeats interact with the eIF4E‐like C terminus of SHLD3.

- Schematic of the domain organization of SHLD3 and RIF1, and the fragments used for additional AF2 analysis.
- Top‐ranked model predicted by AF2 between RIF1 HEAT‐repeat residues 1–615 and SHLD3 eIF4E‐like domain residues 131–250. See also Fig EV2A–D.
- Whole cell extracts of High Five insect cells individually expressing FLAG‐SHLD3, Strep‐RIF1, and 6xHis‐REV7 through baculovirus infection were combined and subjected to FLAG immunoprecipitation or streptactin pulldown and immunoblotted for REV7 or the Strep or FLAG epitopes. Results are representative of three biologically independent experiments. IB—immunoblot. FL—full‐length. For SHLD3, N and C correspond to residues 1–125 and 126–250, respectively.
- Schematic of the LacR/LacO assay using plasmid‐encoded mCherry‐LacR‐fused bait and eGFP‐fused prey proteins transfected in the U2OS 2‐6‐3 cell line containing ~256 lac operator (LacO) repeats.
- Representative micrographs of the LacR/LacO assay using mCherry‐LacR‐RIF1N as bait to evaluate chromatin recruitment of eGFP‐tagged SHLD3 variants. SHLD3: residues 2–250. SHLD3N: residues 2–125. SHLD3C: residues 126–250. RIF1N: residues 1–967. See also Fig EV2E–G.
- Quantification of LacR/LacO assay measuring chromatin recruitment of eGFP‐tagged SHLD3 variants to LacO arrays by mCherry‐LacR‐RIF1N. GFP intensities are presented as a ratio between the average fluorescence intensity within the mCherry‐labeled LacR focus and the average nuclear intensity. Bars represent mean values (n = 138, 126, 129, 137 for eGFP, eGFP‐SHLD3, eGFP‐SHLD3N, eGFP‐SHLD3C from three biologically independent experiments). Analysis was performed by the Kruskal–Wallis test followed by Dunn's multiple comparisons against empty vector control or full‐length eGFP‐SHLD3. ****P < 0.0001. ns P > 0.05.
- Schematic of the LacR‐FokI assay that directs FokI nuclease‐mediated DNA double‐strand breaks to the U2OS 2‐6‐3 LacO array to analyze DNA‐damage localization of eGFP‐fused prey proteins encoded by transfected plasmids.
- Representative micrographs of the LacR‐FokI assay to evaluate DNA‐damage recruitment of eGFP‐tagged SHLD3 variants after induction of LacR‐FokI expression. See also Fig EV2H–J.
- Quantification of LacR‐FokI assay evaluating recruitment of eGFP‐tagged SHLD3 variants to FokI‐induced DSBs at LacO arrays. GFP intensities are presented as a ratio between the average fluorescence intensity within the mCherry‐labeled LacR‐FokI focus and the average nuclear intensity. Bars represent mean (n = 143, 147, 147, 141 for eGFP, eGFP‐SHLD3, eGFP‐SHLD3N, eGFP‐SHLD3C from three biologically independent experiments). Analysis was performed by the Kruskal–Wallis test followed by Dunn's multiple comparisons against empty vector control or full‐length eGFP‐SHLD3. ****P < 0.0001. ns P > 0.05.
Source data are available online for this figure.
