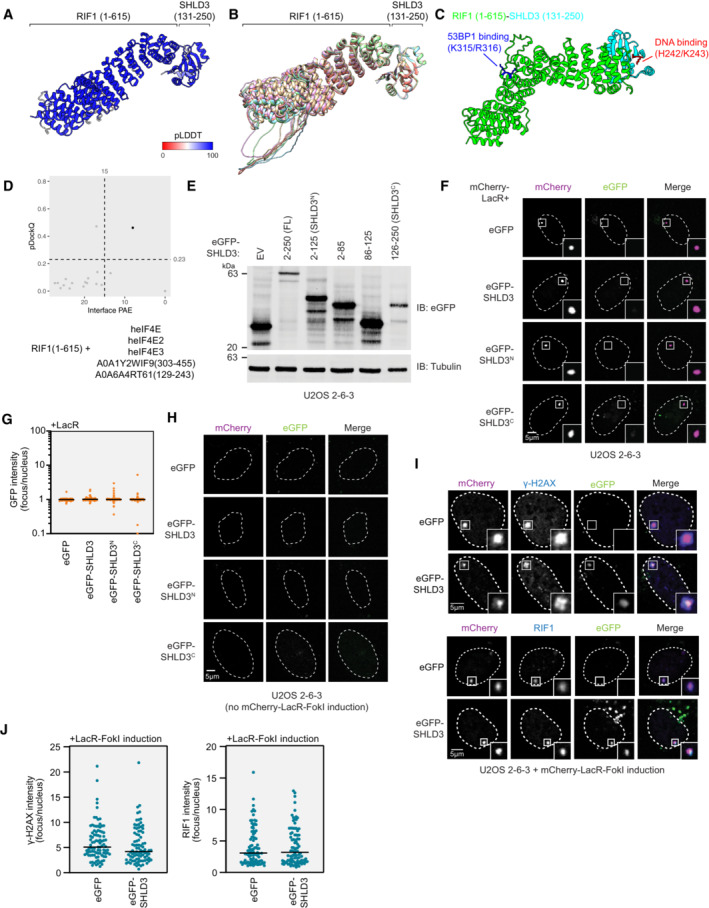
Figure EV2. Data supporting the SHLD3 C terminus as necessary and sufficient for RIF1 binding and recruitment to sites of DNA damage.

- Top‐ranking model of RIF1 (1–615) and SHLD3 (131–250) colored by pLDDT score.
- Five AF2‐predicted models of RIF1 (1–615) and SHLD3 (131–250) superimposed, aligned by the SHLD3 chain.
- Top‐ranking AF2 model of RIF1 (1–615) and SHLD3 (131–250), highlighting residues associated with SHLD3 DNA binding and RIF1 53BP1 phosphopeptide binding.
- Scatter plot of interface PAE vs pDockQ scores of AF2‐predicted models between RIF1 (1–615) with the indicated paralogues of the SHLD3 eIF4E‐like domain. Cutoff scores of 15 Å and 0.23 PAE and pDockQ scores are shown as dotted lines. Models meeting the cutoff are represented as black points and those that do not are represented as gray points.
- Immunoblot of whole cell extracts of U2OS 2‐6‐3 cells transfected with plasmids encoding the indicated eGFP‐tagged SHLD3. Lysates were probed for eGFP and tubulin (loading control). IB—immunoblot. EV—empty vector.
- Representative micrographs of the LacR/LacO assay using mCherry‐LacR as bait to evaluate chromatin recruitment of eGFP‐tagged SHLD3 variants as a control for the experiments using mCherry‐LacR‐RIF1N in Fig 2E and F.
- Quantification of F. GFP intensities are presented as a ratio between the average fluorescence intensity within the mCherry‐labeled LacR focus and the average nuclear intensity. Bars represent mean (n = 140, 138, 131, 133 for eGFP, eGFP‐SHLD3, eGFP‐SHLD3N, eGFP‐SHLD3C from three biologically independent experiments).
- Representative micrographs of control experiments for the LacR‐FokI assay in Fig 2H and I to evaluate DNA‐damage recruitment of eGFP‐tagged SHLD3 variants. LacR‐FokI expression was not induced, and no mCherry‐LacR‐FokI or eGFP‐SHLD3 foci were detected.
- Representative micrographs of the LacR‐FokI assay to evaluate DNA‐damage induction after mCherry‐LacR‐FokI expression. U2OS 2‐6‐3 cells were transfected with plasmids encoding eGFP‐SHLD3 and treated with 4‐hydroxytamoxifen and Shield‐1 peptide to induce mCherry‐LacR‐FokI expression. The cells were then analyzed for γ‐H2AX focus formation colocalizing with mCherry‐LacR‐FokI as a proxy for DNA double‐strand break formation through immunofluorescence (top). Colocalization of mCherry‐LacR‐FokI focus with endogenous RIF1 was also assessed (bottom).
- Quantification of I. Immunofluorescence intensities are presented as a ratio between the average fluorescence intensity within the mCherry‐labeled LacR focus and the average nuclear intensity. Bars represent mean (n = 95, 88, 90, 94 for γ‐H2AX eGFP, γ‐H2AX eGFP‐SHLD3, RIF1 eGFP, RIF1 eGFP‐SHLD3 from two biologically independent experiments).
Source data are available online for this figure.
