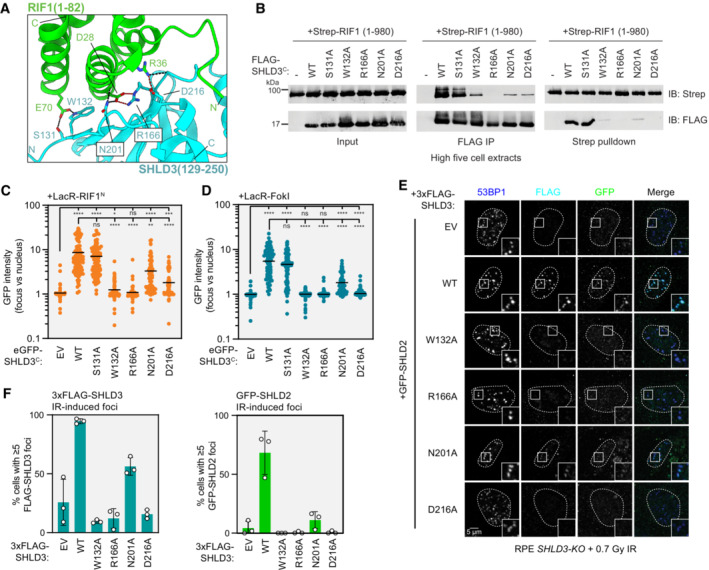
Figure 3. SHLD3 binds RIF1 through polar interactions that are essential for recruitment to DNA breaks.

- Close‐up view of the hydrogen bond and salt bridge network between conserved RIF1 and SHLD3 residues in the AF2‐predicted model. Hydrogen bonds and salt bridges are depicted as black and red dashed lines, respectively.
- Whole cell extracts of High Five insect cells individually expressing the wild‐type (WT) or indicated alanine substitution FLAG‐SHLD3C (residues 126–250) variants and Strep‐RIF1N (residues 1–980) through baculovirus infection were combined and subjected to FLAG immunoprecipitation or streptactin pulldown and immunoblotted for the Strep or FLAG epitopes. The results are representative of two biologically independent experiments. IB—immunoblot. IP—immunoprecipitation.
- Quantification of LacR/LacO assay measuring recruitment of eGFP‐SHLD3C wild‐type (WT) or alanine substitution variants to LacO arrays in U2OS 2‐6‐3 cells by mCherry‐LacR‐RIF1N. GFP intensities are presented as a ratio between the average fluorescence intensity within the mCherry‐labeled LacR‐RIF1N focus and the average nuclear intensity. Bars represent mean values (n = 134, 125, 120, 130, 104, 129, 117 for EV, WT, S131A, W132A, R166A, N201A, D216A from three biologically independent experiments). EV: empty vector. Analysis was performed by the Kruskal–Wallis test followed by Dunn's multiple comparisons against empty vector and WT controls. ****P < 0.0001. ***P = 0.0004. **P = 0.002. *P = 0.02. ns P > 0.05. See also Fig EV3A and B.
- Quantification of LacR‐FokI assay measuring recruitment of eGFP‐SHLD3C wild‐type (WT) or alanine substitution variants to sites of DNA double‐strand breaks induced by mCherry‐LacR‐FokI in U2OS 2‐6‐3 cells. GFP intensities are presented as a ratio between the average fluorescence intensity within the mCherry‐labeled LacR‐FokI focus and the average nuclear intensity. Bars represent mean values (n = 103, 136, 159, 151, 139, 145, 140 for EV, WT, S131A, W132A, R166A, N201A, D216A from three biologically independent experiments). Analysis was performed by the Kruskal–Wallis test followed by Dunn's multiple comparisons against empty vector and WT controls. ****P < 0.0001. ns P > 0.05. See also Fig EV3C and E.
- Representative micrographs of immunofluorescence experiments (from three biologically independent experiments) analyzing localization of SHLD3 and SHLD2 to ionizing radiation‐induced foci. RPE SHLD3‐KO cells were complemented by transduction of lentivirus encoding the indicated 3xFLAG‐SHLD3 variants, transfected with eGFP‐SHLD2‐encoding plasmids, treated with 0.7 Gy X‐ray irradiation, and processed for immunofluorescence microscopy after 1 h using antibodies against 53BP1, FLAG, and GFP.
- Quantification of immunofluorescence experiment analyzing localization of SHLD3 and SHLD2 to ionizing radiation‐induced foci (0.7 Gy) in RPE SHLD3‐KO cells. The percentage of cells containing ≥ 5 53BP1‐colocalizing 3xFLAG‐SHLD3 (top) or eGFP‐SHLD2 (bottom) foci were manually counted. Bars represent mean values ± s.d. (n = 3 biologically independent experiments with ≥ 61 cells imaged each). See also Fig EV3I and J.
Source data are available online for this figure.
