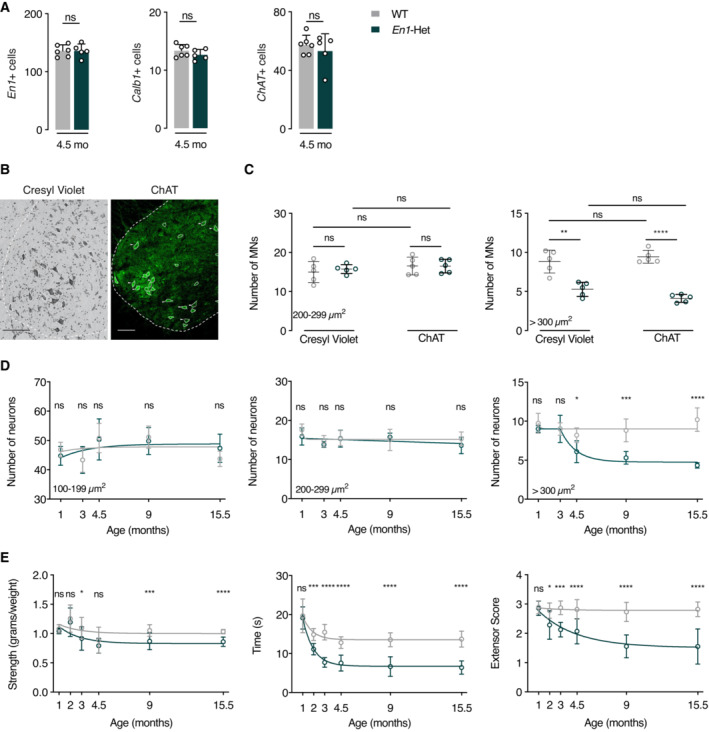
Figure 2. Progressive loss of αMNs and strength decrease in En1‐Het mice.

- Analysis of the number of En1+, Calb1+, and ChAT+ neurons (triple RNAscope). At 4.5 months, WT and En1‐Het mice show no difference in the number of cells expressing En1, Calb1, or ChAT. Unpaired two‐sided t‐test. n = 5–6.
- Cresyl violet and ChAT staining of a ventral WT spinal cord at the lumbar level. Scale bar: 100 μm.
- Cresyl violet and ChAT staining at the lumbar level show no medium‐size (200–299 μm2) cell loss (γMNs) and a decrease of about 50% in the number of large‐size (> 300 μm2) cells (αMNs). Unpaired two‐sided t‐test. **P < 0.005; ****P < 0.0001. n = 5.
- Lumbar level Cresyl violet staining shows that, in contrast with small‐ and medium‐size neurons (interneurons and γMNs, left and center panels), large‐size neurons (αMNs, right panel) undergo progressive death first measured at 4.5 months. The values represent the average number of cells per ventral horn. For the small neurons (100–199 μm2), there was no main effect, two‐way ANOVA for repeated measures for treatment group: F(1, 43) = 0.0017, P = 0.968, ns. For the medium‐sized neurons (200–299 μm2) two‐way ANOVA for repeated measures for treatment group: showed no main effect F(1, 43) = 2.085, ns. For the large neurons (> 300 μm2), two‐way ANOVA for repeated measures showed a significant main effect F(1, 43) = 59.99, P < 0.0001. Post hoc comparisons were performed by unpaired two‐sided t‐test with equal SD comparing WT with En1‐Het at each time point (*P < 0.05; **P < 0.005; ***P < 0.0005; ****P < 0.0001). n = 5–6.
- Compared with WT mice, En1‐Het mice experience gradual strength loss. This loss is observed with the forepaw grip strength (left panel), the inverted grid test (center panel) and the hindlimb extensor reflex test (right panel). Strength loss is first observed between 2 and 3 months, thus before measurable αMN cell body loss. Two‐way ANOVA showed significant main effects for grip strength (F(1, 136) = 19.18, P < 0.0001), inverted grid test (F(1, 103) = 143.1, P < 0.0001), and extensor score (F(1, 103) = 10.1, P < 0.0001). Comparisons were made by unpaired two‐sided t‐test with equal SD comparing WT with En1‐Het at each time point (*P < 0.05; **P < 0.005; ***P < 0.0005; ****P < 0.0001). n = 4–20.
Data information: The analysis of neuron number in (A), the direct comparison of Cresyl violet and ChAT in (C), and the longitudinal studies in (D and E) were performed once. Values are mean ± SD.
Source data are available online for this figure.
