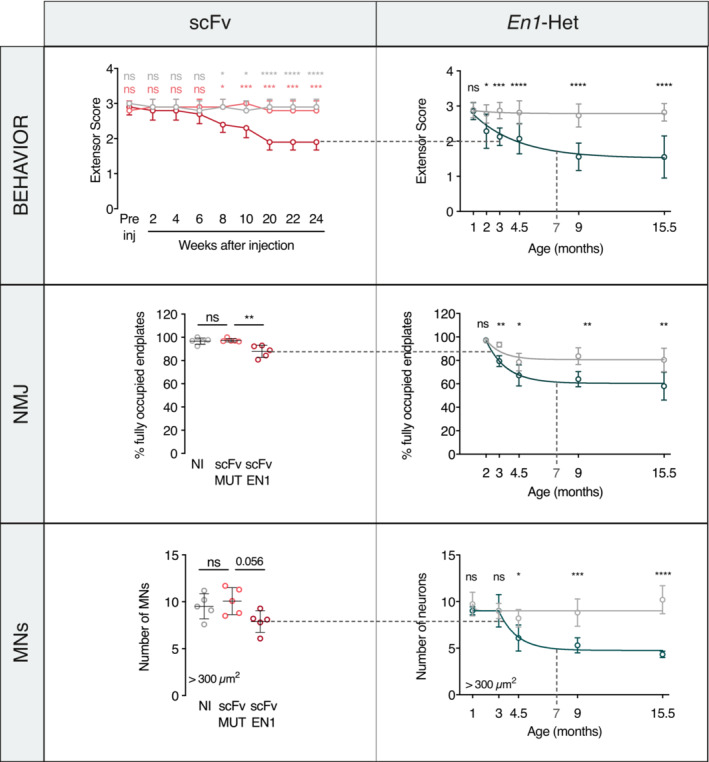
Figure EV4. Comparison of En1‐Het and scFvEN1‐expressing mice phenotypes.

Comparison between En1‐het mouse and scFvEN1 models. Data and graphs are from main figures (primarily Figs 2 and 4). WT mice injected with scFvEN1 show similar results to those obtained in the En1‐Het mouse with a milder strength loss, a smaller decrease in the number of fully occupied endplates, and the specific loss of large‐size αMNs. At 7 months, scFvEN1 injected mice have a phenotype similar to 3‐month‐old En1‐Het mice.
