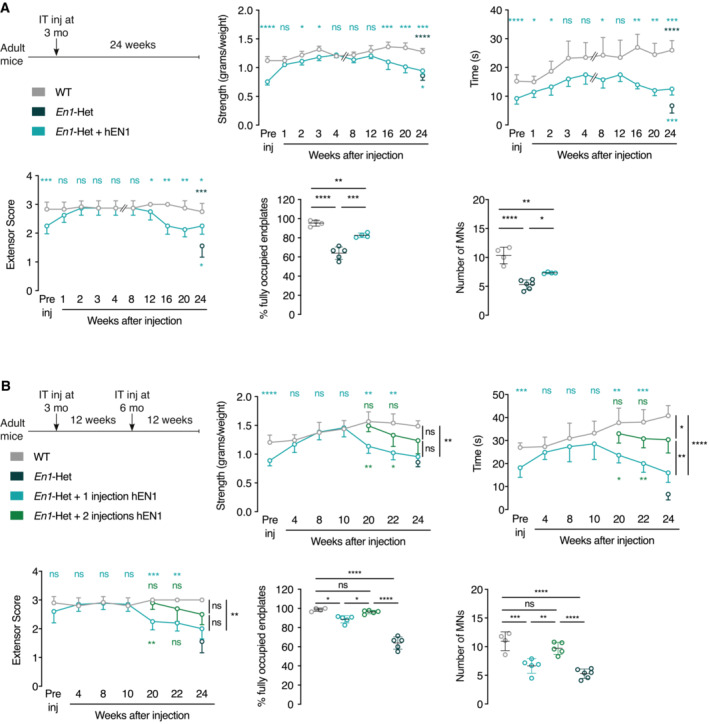
Figure 6. EN1 injection at 3 months has long‐lasting effects on strength, endplate occupancy, and αMN survival and the latter recoveries are prolonged by a second injection.

- Top left panel shows the single injection protocol whereby hEN1 is injected at 3 months (1 μg in 5 μl) intrathecally at the L5 level and mouse behavior followed for 24 weeks. The 3 time‐course graphs demonstrate that a single injection restores strength measured by the tests of grip strength, time on the inverted grid and extensor reflex and that this effect lasts for 12 weeks. After 12 weeks, strength decreases progressively but, even after 24 weeks, remains superior to that of untreated En1‐Het mice. At 24 weeks, the % of fully occupied endplates is inferior to that of WT mice, but superior to that of noninjected En1‐Het mice. The same holds true for the number of αMNs. Two‐way ANOVA revealed significant main effects for grip strength (F(1, 76) = 143.6, P < 0.0001), inverted grid (F(1, 76) = 128.6, P < 0.0001), and extensor score (F(1, 76) = 34.91, P < 0.0001). At the different times, the groups were compared by unpaired t‐test with equal variances comparing WT with En1‐Het injected at each time point. (*P < 0.05; **P < 0.005; ***P < 0.0005; ****P < 0.0001). For the endplate analysis and αMNs, groups were compared by 1‐way ANOVA followed by Tukey corrected post hoc comparisons (*P < 0.05; **P < 0.005; ***P < 0.0005; ****P < 0.0001). n = 4–10.
- Based on the results shown in A, a new experiment was performed with a second injection 12 weeks after the first injection at 3 months of age. Again, the injection at 3 months of age restored strength and in mice receiving the second injection strength was maintained an additional 10 weeks or more compared with mice receiving a single injection. The three strength graphs demonstrate a positive effect of the second injection with values intermediate between those measured in WT mice and En1‐Het mice with a single injection. The percentage of fully occupied endplates and the number of αMNs are back to wild‐type values in En1‐Het mice injected twice. Two‐way ANOVA revealed significant main effects for grip strength (F(2, 81) = 25.47, P < 0.0001), inverted grid (F(2, 91) = 51.96, P < 0.0001), and extensor score (F(2, 104) = 30.42, P < 0.0001). At all times, groups were compared by unpaired t‐test with equal variances through 12 weeks. After, the groups were compared by Tukey corrected post hoc comparisons (*P < 0.05; **P < 0.005; ***P < 0.0005; ****P < 0.0001). For the endplate analysis and αMNs, groups were compared by 1‐way ANOVA followed by Tukey corrected post hoc comparisons (*P < 0.05; **P < 0.005; ***P < 0.0005; ****P < 0.0001). n = 4–10.
Data information: The single injection and two injection time‐course studies were performed once each. Values are mean ± SD.
Source data are available online for this figure.
