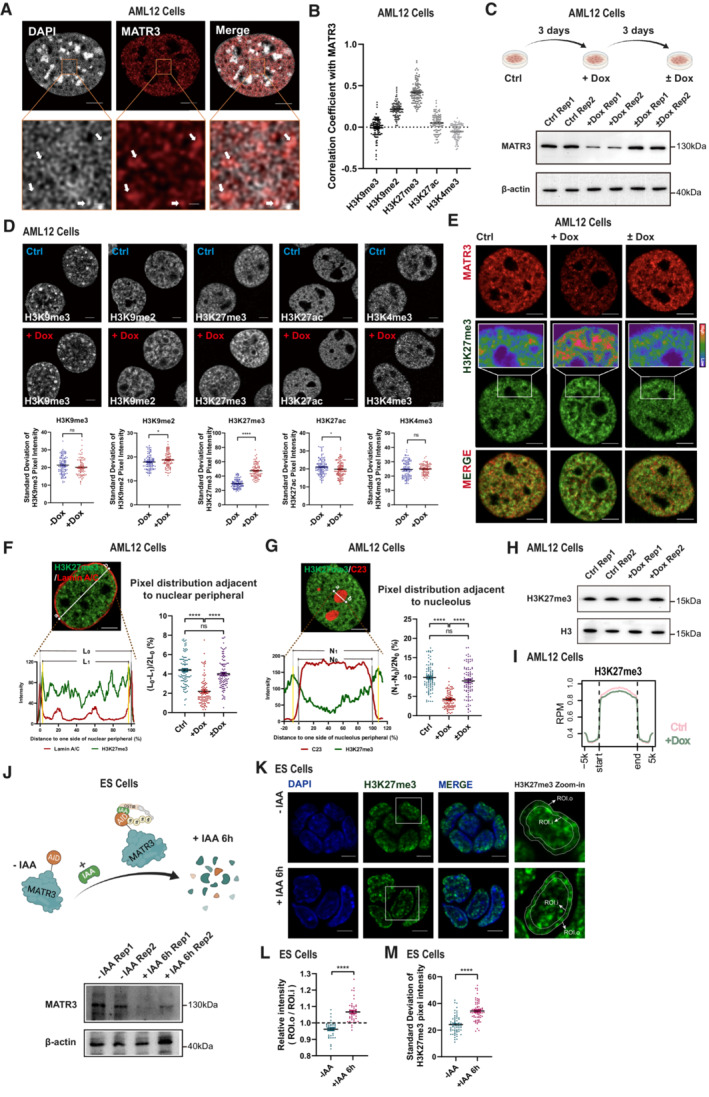
Figure 1. MATR3 regulates the spatial organization of chromatin.

-
ASuper‐resolution fluorescence microscopy images showing relative distribution between MATR3 and DAPI. Scale bars, 5 μm (Upper) or 0.5 μm (Lower). Arrows point to the representative MATR3/DAPI co‐staining regions.
-
BCoefficient of correlation between MATR3 and histone modification H3K9me3 (n = 105), H3K9me2 (n = 98), H3K27me3 (n = 107), H3K27ac (n = 97) and H3K4me3 (n = 99) in AML12 cells. Quantifications were performed on randomly selected ROIs in cell nuclei. Also see Fig EV1B. Each point represents one cell.
-
C(Upper) Schematic diagram of dox‐inducible shRNA system for MATR3 knockdown and MATR3 rescue in AML12 cells. (Lower) Western blotting detected the expression level of MATR3 after 3 days of Dox treatment (+Dox) and followed by 3 days of Dox removal (±Dox) in AML12 cells. Rep, replicate.
-
D(Upper) Representative cross‐section images showing the distribution of histone modifications upon Ctrl and MATR3 knockdown (+Dox). (Lower) Quantify the distribution pattern of histone modifications by Standard Deviation of Pixel Intensity in cell nuclei. For H3K9me3, n = 102 (Ctrl) or 84 (+Dox); for H3K9me2, n = 100 (Ctrl) or 101 (+Dox); for H3K27me3, n = 98 (Ctrl) or 98 (+Dox); for H3K27ac, n = 117 (Ctrl) or 124 (+Dox); for H3K27me3, n = 98 (Ctrl) or 98 (+Dox); for H3K4me3, n = 107 (Ctrl) or 97 (+Dox). Each point represents one cell. The P‐values were calculated using unpaired two‐tailed Student's t‐test; ns, not significant, *P < 0.05, ****P < 0.0001. Error bars indicate mean ± s.e.m.
-
ERepresentative cross‐section images showing nuclear localization of MATR3 and H3K27me3 upon Ctrl, MATR3 knockdown (+Dox) and MATR3 rescue (±Dox). Scale bars, 5 μm.
-
FRelative distribution of H3K27me3 and Lamin A/C. L0, region between nuclear membrane (position of nuclear membrane was determined by the X‐axis of the Lamin A/C pixel peaks on both sides). L1, region between two H3K27me3 pixel peaks that closest to the nuclear membrane. Quantify changes in H3K27me3 distribution adjacent to nuclear peripheral in Ctrl (n = 95), MATR3 knockdown (+Dox) (n = 92) and MATR3 rescue (±Dox) (n = 98) cells by formula of (L0‐L1)/2L0 (%). Scale bars, 5 μm. Each point represents one cell. The P‐values were calculated using unpaired two‐tailed Student's t‐test; ns, not significant, ****P < 0.0001. Error bars indicate mean ± s.e.m.
-
GRelative distribution of H3K27me3 and C23. N0, region between nucleolus membrane (position of nucleolus membrane was determined by the X‐axis of the half‐peaks on both sides). N1, region between two H3K27me3 pixel peaks that are closest to the nucleolus membrane. Quantify changes in H3K27me3 distribution adjacent to nucleolus in Ctrl (n = 91), MATR3 knockdown (n = 91) and MATR3 rescue (n = 92) cells by formula of (N1‐N0)/2N0 (%). Scale bars, 5 μm. Each point represents one cell. The P‐values were calculated using unpaired two‐tailed Student's t‐test; ns, not significant, ****P < 0.0001. Error bars indicate mean ± s.e.m.
-
HH3K27me3 modification level upon Ctrl and MATR3 knockdown (+Dox) as detected by western blotting. Rep, replication.
-
IAverage enrichment of H3K27me3 ChIP‐seq signal at peaks regions with 5 kb upstream and downstream flanking regions in Ctrl and shMatr3 from AML12 cells.
-
J(Upper) Schematic diagram of IAA‐inducible rapid protein degradation system for MATR3 in ES cells. (Lower) Western blotting detection of the efficiency of MATR3 knockdown in ES cells after 6 h addiction of 500 μM IAA or equal volume of alcohol (−IAA). Rep, replication.
-
KRepresentative cross‐section images showing nuclear localization of H3K27me3 in ES cells after 6 h addiction of 500 μM IAA (+IAA 6 h) or equal volume of alcohol (−IAA). Middle: The zoom‐in view of H3K27me3 in one ES cell. The outer dotted line colocalizes with nuclear membrane; the inner dotted line has the 80% diameter of the outer dotted line. The average pixel intensity of regions within outer dotted line (ROI.o) and regions within inner dotted line (ROI.i) were measured separately for each cell. Scale bars, 5 μm.
-
LStatistics for relative intensity (ROI.o/ ROI.i) after 6 h addiction of 500 μM IAA (+IAA 6 h) (n = 46) or equal volume of alcohol (−IAA) (n = 38). Each point represents one cell. The P‐values were calculated using unpaired two‐tailed Student's t‐test; ****P < 0.0001. Error bars indicate mean ± s.e.m.
-
MStandard deviation of H3K27me3 pixel intensity after 6 h addiction of 500 μM IAA (+IAA 6 h) (n = 68) or equal volume of alcohol (−IAA) (n = 60). Each point represents one cell. The P‐values were calculated using unpaired two‐tailed Student's t‐test; ****P < 0.0001. Error bars indicate mean ± s.e.m.
Source data are available online for this figure.
