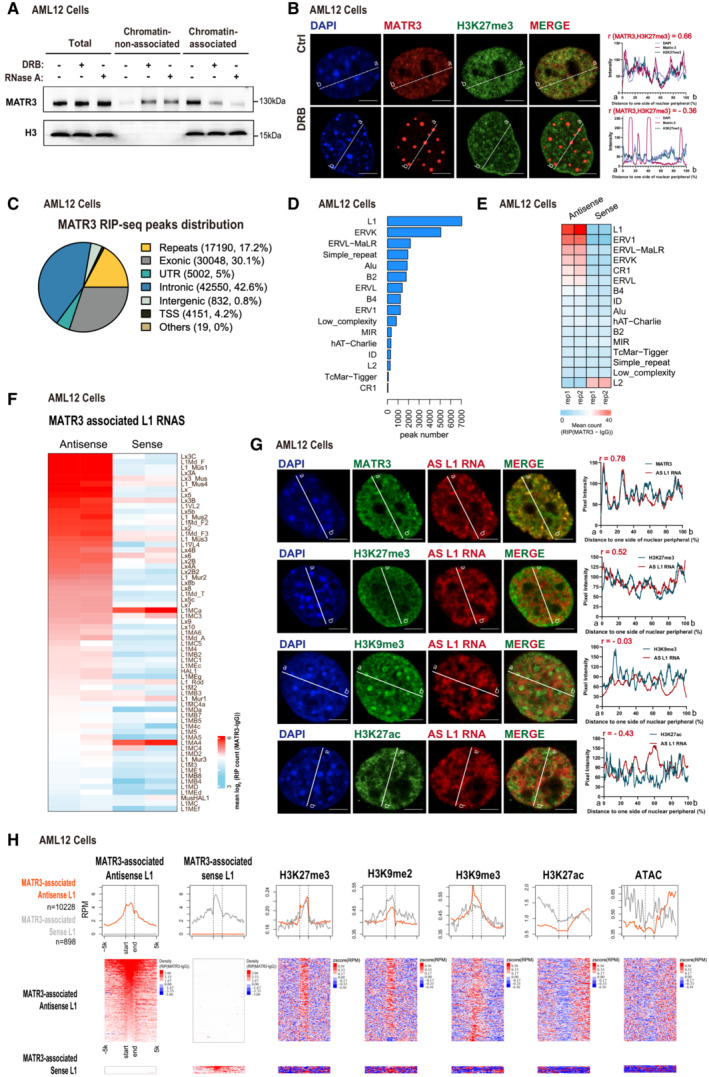
Figure 2. MATR3 associates with nuclear RNAs including repeat elements‐derived transcripts.

-
AWestern blotting showing the distribution of MATR3 proteins in chromatin‐non‐associated and chromatin‐associated extracts before and after DRB (75 μM for 12 h) or RNase A (pretreat with 0.05% Triton x‐100 for 30s, followed by 10 μg/ml RNase A for 1 h) treatment in AML12 cells. Representative of two independent replicates with similar results.
-
B(Left) The representative cross‐section image showing nuclear distribution of DAPI, MATR3 and H3K27me3 before and after 24 h treating of 75 μM DRB in AML12 cells. (Right) Line charts showing pixel intensity of each channel on the ROIs. r, coefficient of correlation. Scale bars, 5 μm.
-
CPie chart showing the MATR3 RIP‐seq peaks in relation to the genomic features. For each MATR3 RIP‐seq peak, we found its overlap with the genomic features and annotated. The priority of features is TSS, UTR, exonic, intronic, repeats, intergenic and others.
-
DThe number of MATR3 RIP‐seq peaks in repetitive elements (REs) from AML12 cells.
-
EHeatmap of MATR3 RIP‐seq sense and antisense signal of repetitive elements from AML12 cells. All RE copies with the RIP (MATR3 ‐IgG) count number ≥ 10 are kept. For each RE family, copies from antisense and sense of two replicates are merged. Then, compute the RIP (MATR3 ‐IgG) count number for RE copies and compute the mean count of RIP (MATR3 ‐IgG) of each sample. The color indicates the mean reads count of RIP (MATR3 ‐IgG) for each RE family.
-
FHeatmap of MATR3 RIP‐seq antisense and sense signal for MATR3 associated L1 subfamilies. L1 subfamilies are considered as MATR3 associated if the subfamily contains more than 50 copies. The copies with RIP (MATR3 ‐IgG) count number ≥ 10 are kept. L1 RNAs are ranked by antisense mean reads count. The color indicates the mean reads count of RIP (MATR3 ‐IgG) for each L1 subfamily.
-
G(Left) Representative cross‐section images showing relative distribution between AS L1 RNA with MATR3 and with histone modification marks (H3K27me3, H3K9me3 and H3K27ac) in AML12 cells. Probes for RNA FISH were designed toward the consensus sequence of antisense L1_Mus1 RNAs. (Right) Line charts showing pixel intensity of each channel on the ROIs. Scale bars, 5 μm. r, coefficient of correlation.
-
HNormalized average density of the marks (top) and heatmaps(bottom) for the two groups of L1 loci. The two groups are antisense L1 RNAs or sense L1 RNAs that interacted with MATR3. L1 loci with RIP (MATR3 ‐IgG) count number ≥ 10 of antisense RNA were identified as MATR3‐associated antisense L1, and the same cutoff for MATR3‐associated sense L1.
Source data are available online for this figure.
