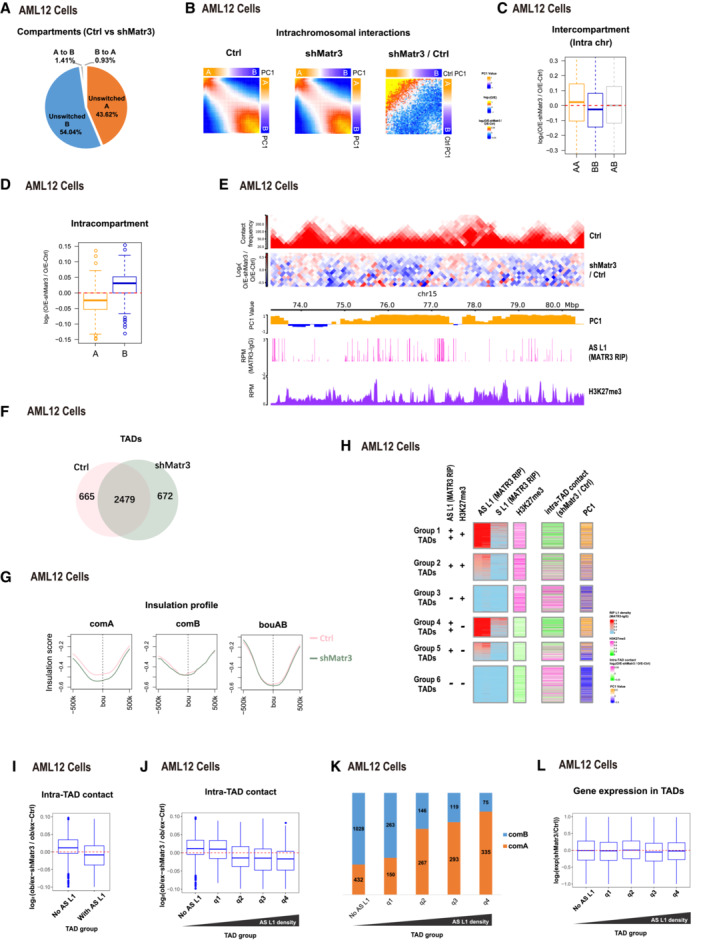
Figure 5. 3D genome organization changes on compartments and TADs upon MATR3 depletion.

-
APercentages of compartment status at unswitched A, unswitched B, B switched to A and A switched to B between Ctrl and shMatr3.
-
BAverage contact enrichment between pairs of 100 kb loci in Ctrl, shMatr3 and the comparison between them. All the 100 kb loci are arranged by Ctrl PC1 values in decreasing order and divided into 50 quantiles. Average enrichment of PC1 values is calculated for each quantile.
-
CChanges in contacts between compartment regions from the same (AA or BB) and different (AB) type in Ctrl and shMatr3. Data are represented as boxplots based on log2(O/E‐shMatr3/O/E‐Ctrl) values per pair. The number of compartment A and B are 1,456 and 1,573. The box of the boxplot covers the 50% of the values between 1st quartile and 3rd quartile of each group; The horizontal line of box represents the median value of each group; Red dashed lines indicate the zero.
-
DChanges in contacts within A or B compartment regions between Ctrl and shMatr3. Data are represented as boxplots based on log2(O/E‐shMatr3/O/E‐Ctrl) values per compartment region. The box of the boxplot covers the 50% of the values between 1st quartile and 3rd quartile of each group; Boxplot whiskers represent the minimal and maximal values of each group; The horizontal line of box represents the median value of each group; Red dashed lines indicate the zero.
-
ESnapshot of an example region, showing Hi‐C, H3K27me3 ChIP‐seq and AS L1 in MATR3 RIP‐seq in Ctrl and/or shMatr3 samples, using HiCExplorer. The values on the y‐axis for Hi‐C contact and O/E heatmap are iced normalized read counts at 100 kb resolution. The values on the y‐axis for ChIP‐seq and RIP‐seq are average reads per million of mapped reads (RPM).
-
FVenn diagram shows the common and sample‐specific TADs between Ctrl and shMatr3 samples. The TADs that overlapped length/TAD length > 0.8 both in Ctrl and shMatr3 samples were identified as common TADs.
-
GInsulation strength at TAD boundaries within compartment A, B regions or AB boundaries.
-
HHeatmap showing six groups of TADs based on average enrichment of AS L1 MATR3 RIP‐seq signal and H3K27me3 ChIP‐seq signal from ctrl cells. Enrichment of AS L1 in MATR3 RIP‐seq classified into strong enriched (++), enriched (+) and none (−) levels. Enrichment of H3K27me3 classified into enriched (+) and none (−) levels. Average enrichment of intra‐TAD contact and PC1 is calculated for each TAD.
-
IIntra‐TAD contacts changes in TADs associated with MATR3‐AS L1 RNAs TADs and nonassociated TADs according to density of anti‐MATR3 RIP‐seq signal of AS L1 RNAs. The y‐axis showing log2 contacts changes between shMatr3 and ctrl cells. The contacts are the density of the observed contacts normalized by the density of the expected contacts. The number of TADs associated with MATR3‐AS L1 RNAs and nonassociated are 1,658 and 1,486. The box of the boxplot covers the 50% of the values between 1st quartile and 3rd quartile of each group; Boxplot whiskers represent the minimal and maximal values of each group; The horizontal line of box represents the median value of each group; Red dashed lines indicate the zero.
-
JIntra‐TAD contacts changes in TADs nonassociated with MATR3‐AS L1 RNAs and four quantile groups associated with MATR3‐AS L1 RNAs ranking by increasing in MATR3‐AS L1 RNAs density. The number of TADs nonassociated with MATR3‐AS L1 RNAs and associated four quantile groups is 1,486, 415, 415, 415, and 413. The box of the boxplot covers the 50% of the values between 1st quartile and 3rd quartile of each group; Boxplot whiskers represent the minimal and maximal values of each group; The horizontal line of box represents the median value of each group; Red dashed lines indicate the zero.
-
KPercentage of TADs located in compartment A or B regions from five TAD groups (same groups in [J]).
-
LBoxplot shows gene expression changes for TAD groups from (J). The number of genes in each group are 2,050, 2,094, 2,356, 2,071 and 1,605. The box of the boxplot covers the 50% of the values between 1st quartile and 3rd quartile of each group; Boxplot whiskers represent the minimal and maximal values of each group; The horizontal line of box represents the median value of each group; Red dashed lines indicate the zero.
Source data are available online for this figure.
