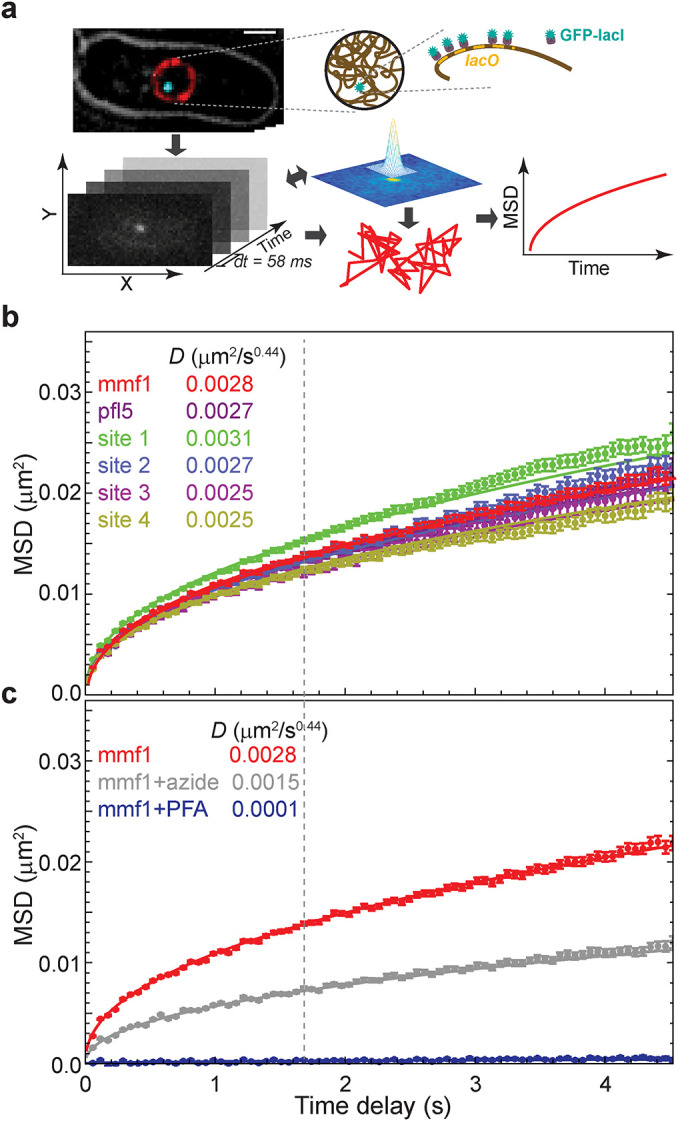
FIGURE 1:

Visualization and tracking of DNA loci over time reveals characteristic, ATP-dependent chromatin dynamics in fission yeast. (a) Cells labeled with a lacO array inserted adjacent to the gene of interest or at random are visualized using GFP-LacI fluorescence. DNA loci are tracked using a custom two-dimensional single particle tracking algorithm (Bailey et al., 2021). (b) Chromatin diffusivity is nearly identical across six different genomic locations as shown by the MSD of each genetic locus as a function of the time. Dashed line marks “window of observation,” along with its calculated diffusion coefficient, D. (c) Cells depleted of ATP by treatment with sodium azide show much slower chromatin dynamics. For comparison, cells fixed with formaldehyde were imaged and analyzed to estimate systematic error in our image acquisition and analysis system. Error bars in panels b and c designate standard errors of the mean. Lines are the best fit of Eq. 1 with the indicated D values.
