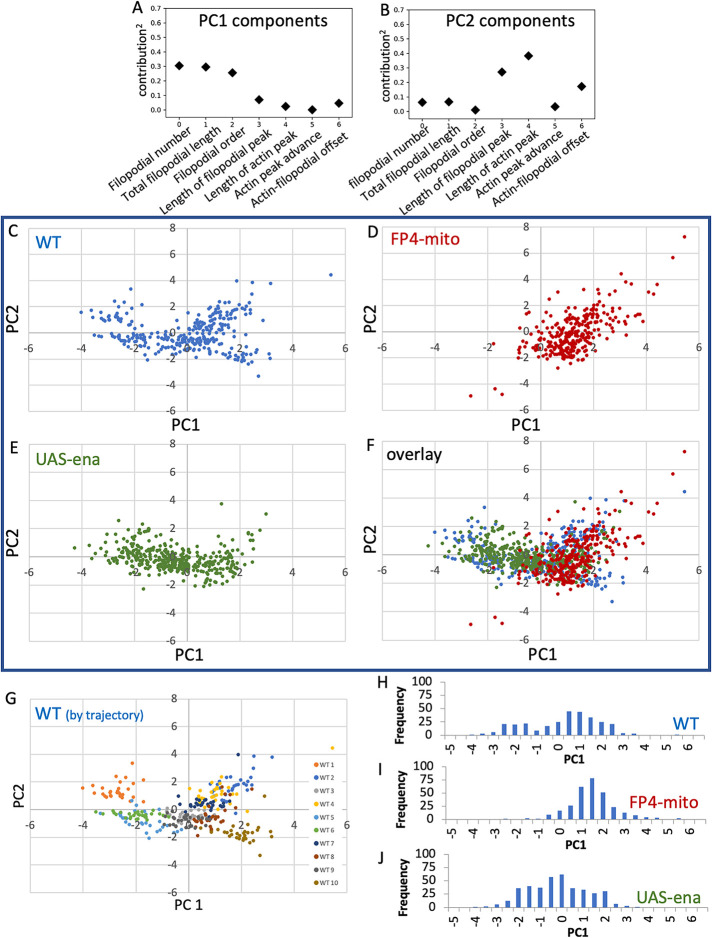
FIGURE 7:
Principal component analysis (PCA) of all parameters for each ena genotype. (A, B) Fractional contribution to each of the first two principal components is shown for each measured parameter. (Contribution)2 is shown to facilitate comparison. (C–F) PCA was performed on WT using all seven parameters, and data from UAS-FP4-mito and UAS-ena datasets were then projected into the WT PCA space. The plane corresponding to PC 1 and 2 is shown. C–E show the three genotypes individually; F shows the overlay of all three genotypes. (G) PCA of WT is shown with each imaged cell colored separately. Note separation of trajectories into a cluster of three cells with PC1 less than approximately -0.5, and a second cluster with PC1 greater than that value. (H–J) Histogram of PC1 values for the three ena genotypes, as indicated. Note the bimodal distribution of PC1 in WT, coincidence of PC1 values of FP4-mito with the higher-value WT cluster, and PC1 values of UAS-ena concentrated roughly around the value of the minimum in PC1 values of WT.

