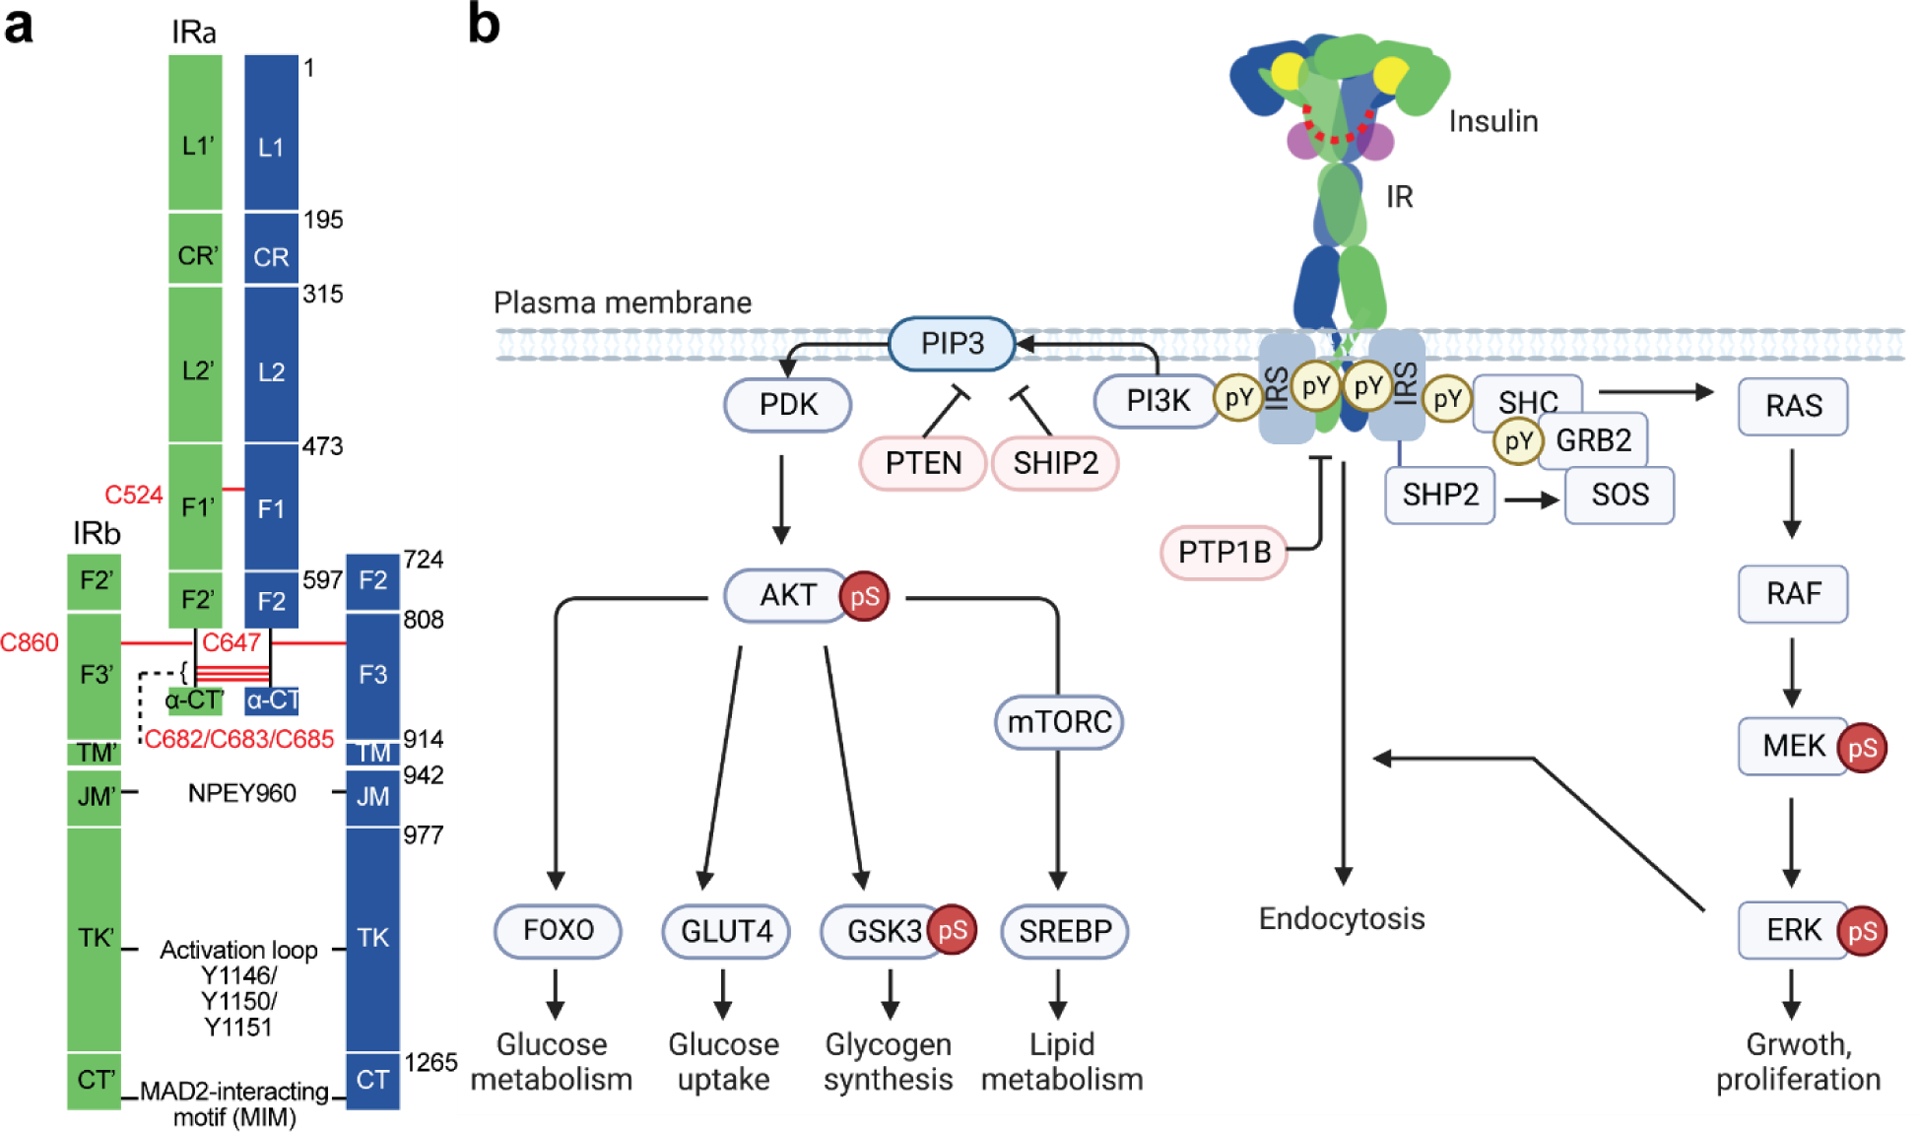
Figure 1.

Structure and signaling of IR. (a) Schematic representation of the structure of the disulfide-linked IR. Each protomer is shown in green and blue. Disulfide bonds are shown in red. NPEY motif, MAD2-teracting motif (MIM), and tyrosine triplets in the activation loop are indicated. Leucine-rich-repeat (L1 and L2); cysteine-rich region (CR); fibronectin type III (F1, F2, and F3); C-terminal domain of α-subunit (α-CT); transmembrane (TM); juxtamembrane (JM); tyrosine kinase (TK); C-terminal region of β-subunit (CT). (b) Insulin-activated IR triggers two signaling cascades; PI3K-AKT pathway and MAPK pathway. The IR undergoes endocytosis, which redistributes and terminates the IR signaling. Protein nomenclatures are defined in the main text. Phosphor-Tyr (pY) and phosphor-Ser/Thr (pS). Arrows and blunt ends indicate activation and inhibition, respectively.
