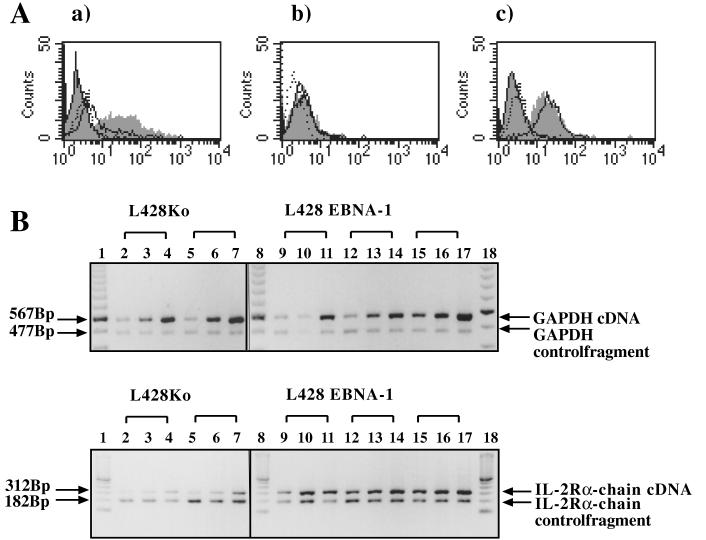
FIG. 2.
Expression of IL-2R molecules in L428 cells expressing EBNA-1. (A) Surface phenotype analysis of L428 clones for CD25–IL-2R α chain (a), CD122–IL-2R β chain (b), and IL-2R γ chain (c). EBNA-1-expressing L428 cells or vector control cells were stained with isotype controls and corresponding PE-conjugated antibodies directed against CD25, CD122, and IL-2 γ chain. Vector control cells were stained with isotype control (dashed outline and no shading) or with specific antibody (solid outline and no shading). EBNA-1-expressing clones were stained with isotype control (solid outline with shading) or with specific antibody (shading and no outline). In this analysis, the clones L428KoP N6 and L428E1P F1 were used. (B) Seminquantitative RT-PCR of total RNA isolated from L428 cells expressing EBNA-1 or vector-transfected control cells. RNA was reverse transcribed, and defined increasing amounts of cDNA were amplified with both glyceraldehyde-3-phosphate dehydrogenase (GAPDH)-specific oligonucleotides to normalize the amount of cDNA and IL-2R α-chain-specific oligonucleotides. In both reactions, a control vector at fixed amounts carrying synthetic binding sites for glyceraldehyde-3-phosphate dehydrogenase–IL-2R α-chain oligonucleotides was included (37). For this analysis, clones L428KoP N1, L428KoP N6, L428E1P F1, L428E1P E1, and L428E1P F4 were used (see also Table 2).

