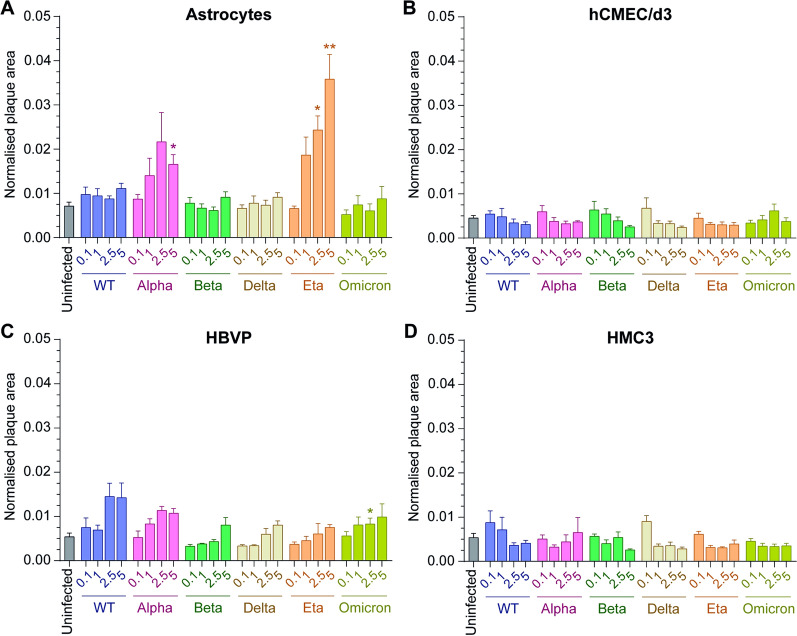
Fig. 1.
Variation in susceptibility of CNS cells to SARS-CoV-2. A Astrocytes, B hCMEC/d3, C HBVP and D HMC3 were infected for 24 h at various MOI (0.1 – 1 – 2.5 – 5) with WT (blue), Alpha (pink), Beta (green), Delta (brown), Eta (orange) or Omicron (yellow-green) viruses. The uninfected condition of each CNS cell (grey) is shown and form the background. The mean and SEM for 3 different donors/passages are shown. The normalised plaque area (fluorescent viral areas (µm2) normalised over fluorescent nuclei areas (µm2)) is presented. Asterisks denote statistically significant data as determined by two-way analysis of variance (ANOVA) with corrections for multiple comparisons (Dunnett) (*P < 0.05, **P < 0.01)

