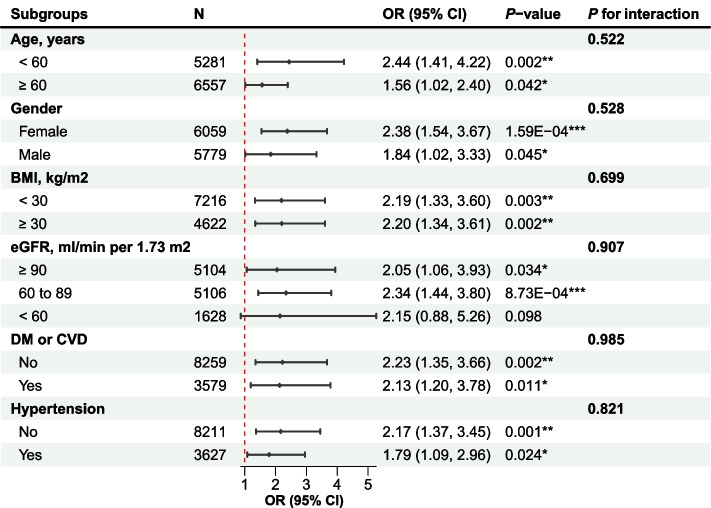
Fig. 4.
Forest Plot for Subgroup Analyses of the Association Between RC and Frailty. Adjusted for age (continuous), gender (female and male), ethnicity (white, black, or other), education level (below high school, or high school and above), marital status (non-married or married), smoking status (never, former, and current), HEI-2015 (quartile), BMI (continuous), SBP (continuous), DBP (continuous), eGFR level (≥ 90, 60 to 89, and < 60 ml/min per 1.73 m2), CVD (no or yes), DM (no or yes), statins use (no or yes), anti-Diabetic drug use, anti-Hypertensive drug use, TC (continuous), and LDL-C (continuous), except the subgroup variable. P-value for interaction was corrected for false discovery rate (FDR)-based multiple hypothesis testing. *, < 0.05; **, < 0.01; ***, < 0.001

