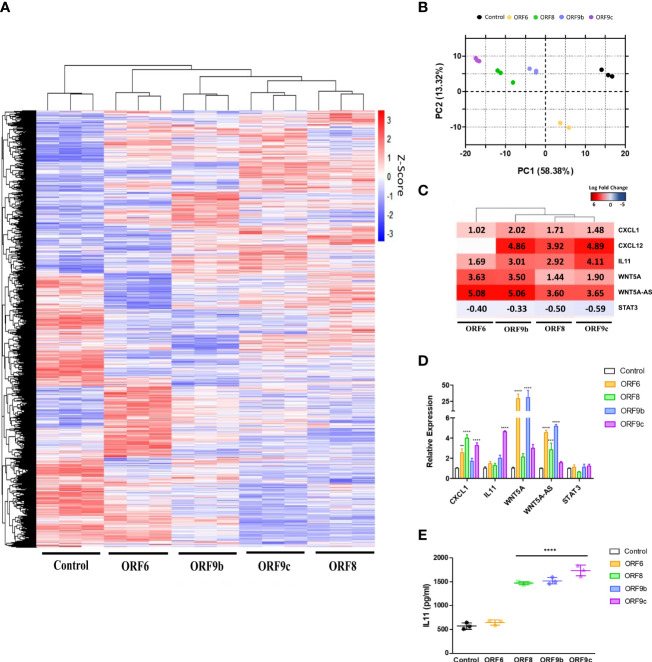
Figure 2.
Differentially expressed genes (DEGs) in ORF-A549. (A) Heatmap of RNA-Seq analysis of transduced cells expressing viral proteins. (B) PCA graph of A549 control cells and A549 cells transduced with ORF6, ORF8, ORF9b or ORF9c. (C) Log2 Fold Change heatmap of WNT5A and IL11 signaling pathways related genes. (D) qRT-PCR gene expression levels calculated with 2-ΔΔCT method by normalizing to that of GADPH. (E) ELISA of secreted IL11 by transduced cells after 24h. Error bars represent mean ± SD (n=3). Statistical significance is given as follows: **p < 0.01 or **** p < 0.0001 to A549 control cells.

