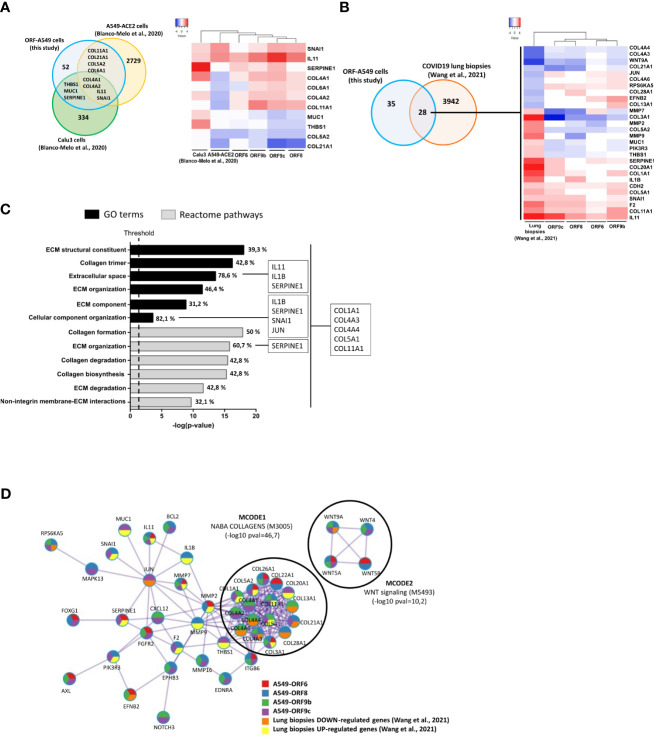
Figure 6.
Comparison of gene expression responses with SARS-CoV-2 infected lung cell lines and COVID-19 lung biopsies. (A) Venn diagram of the intersection between differentially expressed fibrosis-related genes in ORF-A549 cells generated in this study with two SARS-CoV-2 infected lung cell lines from Blanco-Melo et al., 2020 (left) and heatmap showing differential gene expression pattern (right). (B) Venn diagram of the intersection between differentially expressed fibrosis-related genes in ORF-A549 cells generated in this study with COVID-19 lung biopsies from Wang et al., 2021 (left) and heatmap showing differential expression pattern (right). (C) Enrichment study clustering common fibrosis-related genes between ORF-A549 cells generated in this study with COVID-19 lung biopsies according to GO Terms and Reactome pathways. Most statistically significant pathways involved in fibrosis are represented. Percentage of genes implicated in each category is indicated in each bar. More representative genes in one or all pathways are stated. (D) Most relevant MCODE components identified from the PPI network. Network nodes are displayed as pies. The color code represents a gene list (metascape.org).

