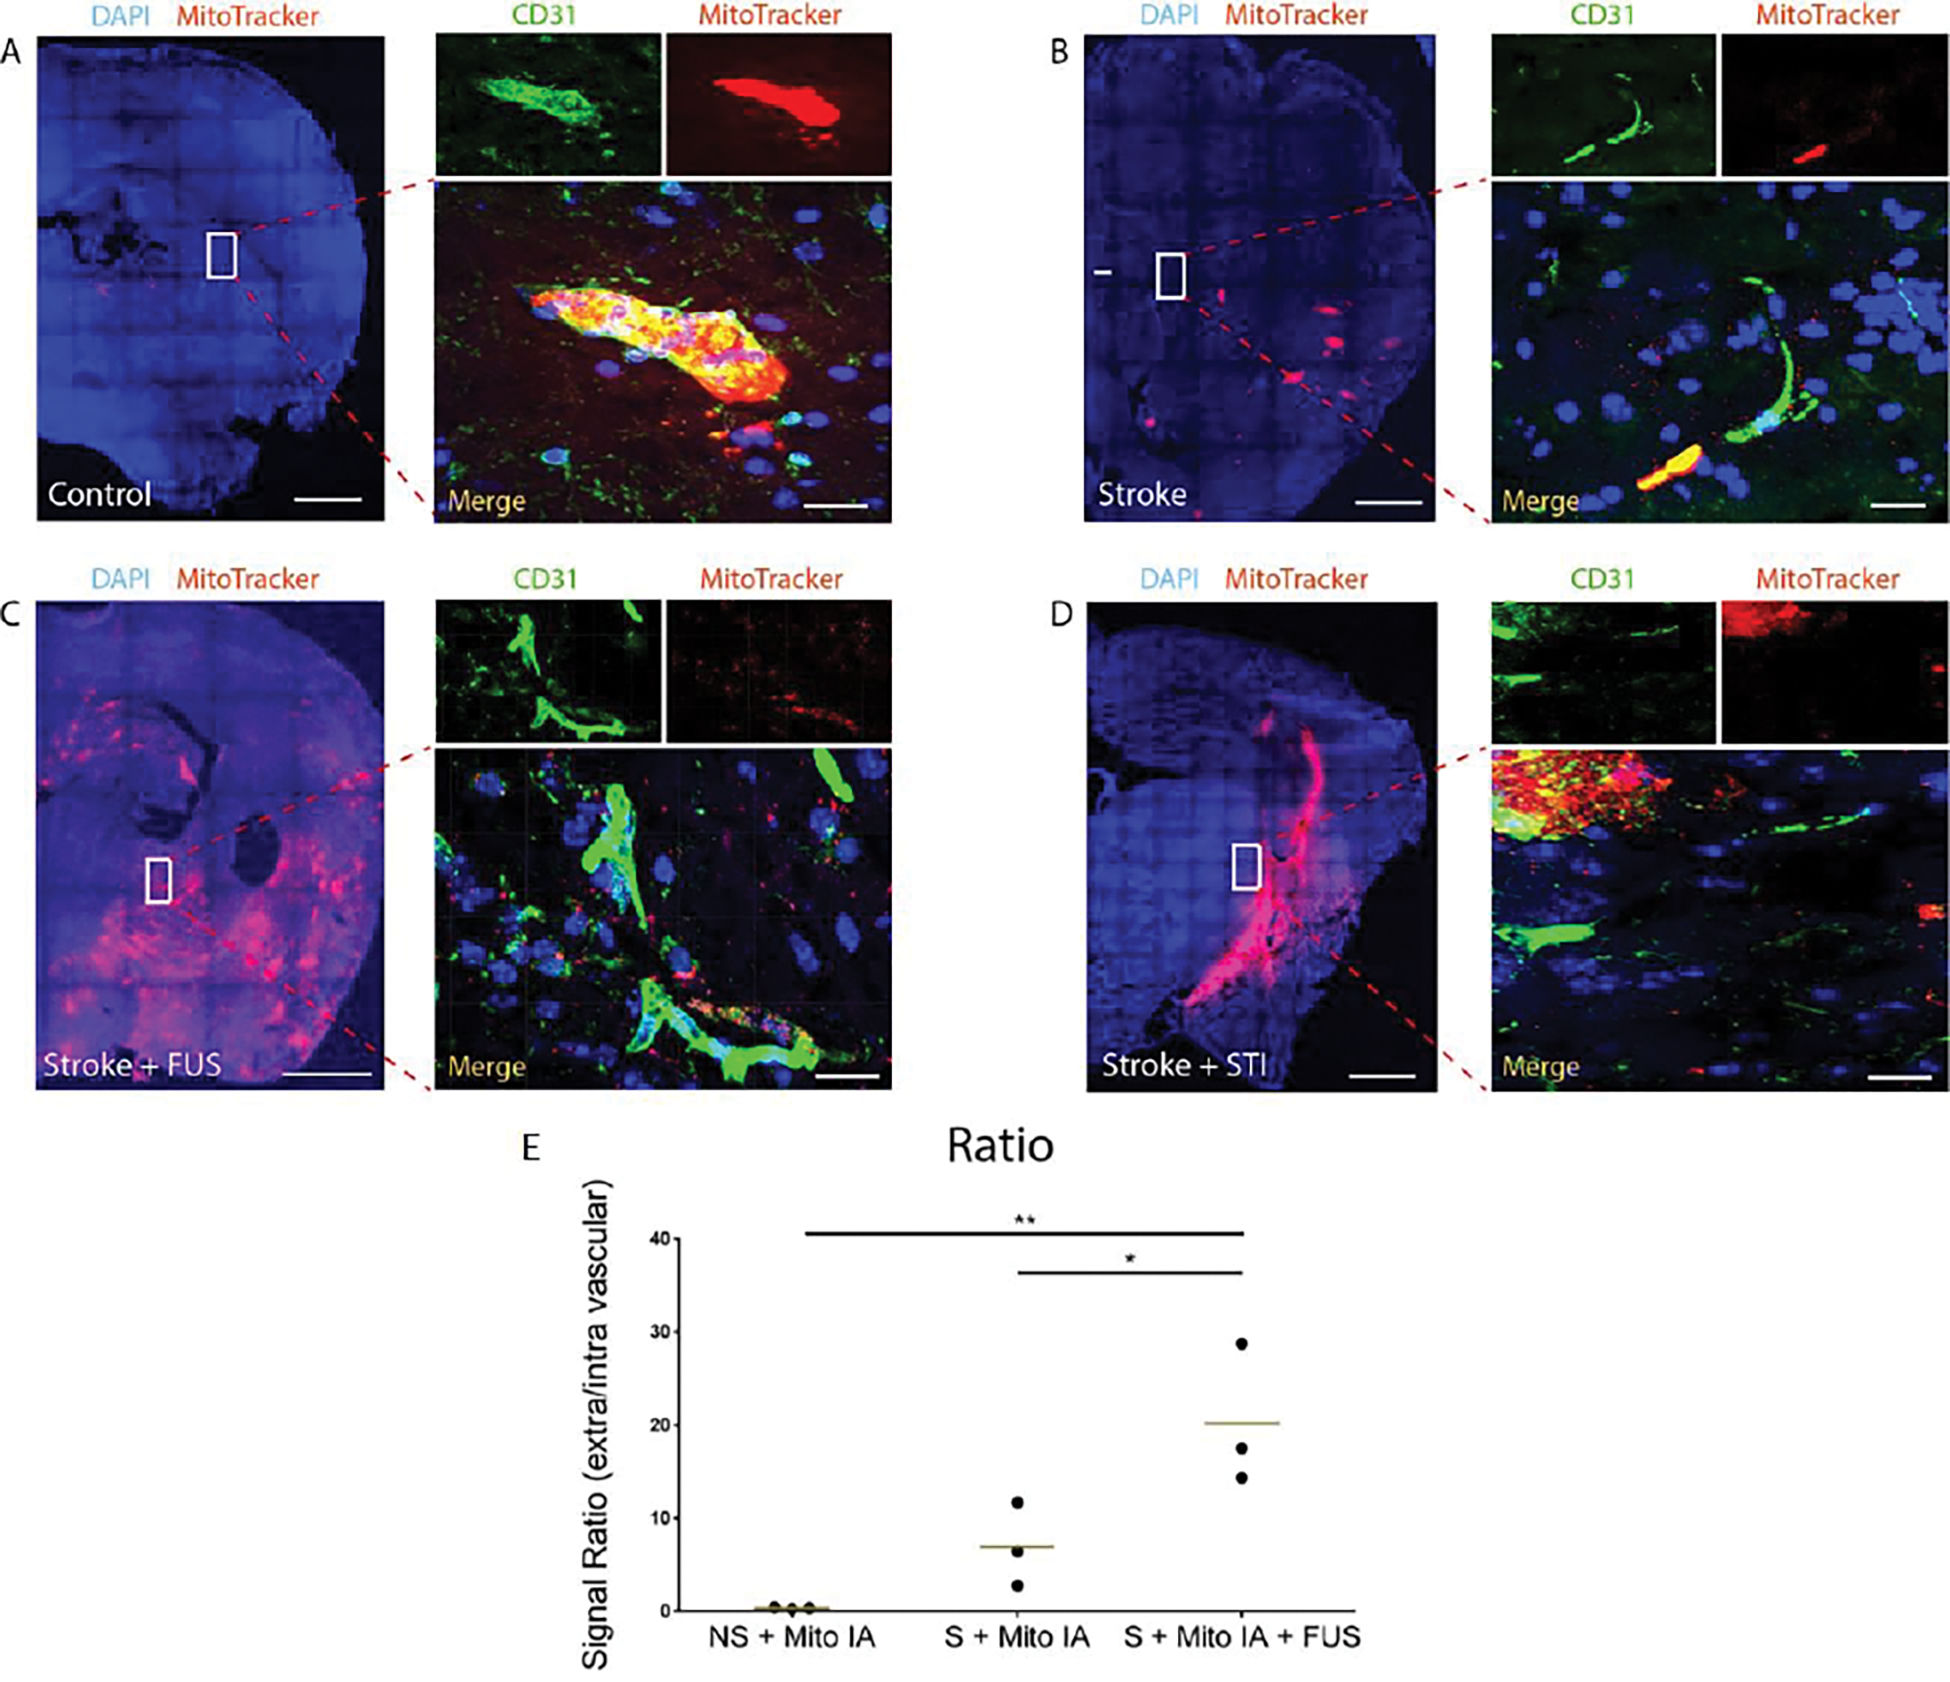
Figure 2. Intra-arterially infused mitochondria permeate ischemic blood-brain barrier.

A, Intra-arterial delivery of mitochondria in the normal brain results in a limited diffusion of mitochondria in the parenchyma. Scale bar, 700 μm. High Magnification image demonstrating details of a CD31-labeled blood vessel containing fluorescently labeled mitochondria with limited extravasation. Scale bar, 15 μm. B, Intra-arterial injection of mitochondria into acute ischemic stroke. The DAPI-stained whole hemisphere image shows the highest density of extravasating mitochondria in the infarct core. Scale bar, 700 μm. In the high magnification image, mitochondrial signal was detected inside the blood vessels as well as outside of the vessels in the brain parenchyma. Scale bar, 15 μm. C, After intra-arterial delivery of mitochondria into acute ischemic stroke with subsequent FUS + MBs, an increased permeation of mitochondria in the stroked hemisphere was observed, including in the surrounding penumbra. Scale bar, 700 μm. Furthermore, in the magnified image, mitochondrial deposits in the blood vessels were infrequent. Scale bar, 15 μm. D, For comparison, direct stereotactic injections into the stroked hemisphere were performed. This route resulted in a robust loading with limited diffusion. Scale bar, 700 μm. High power image shows a fluctuating density of mitochondria in the parenchyma and absence of mitochondrial signal in the vessels. Scale bar, 20 μm. E, Plot summarizing the ratios of signals shown in the extra vascular and intra vascular space. NS + Mito IA, intra-arterial mitochondrial infusion in the control brains; S + Mito IA, intra-arterial mitochondrial infusion in the stroked brains; S + Mito IA + FUS, intra-arterial mitochondrial infusion in the stroked brains preceded by focused ultrasound. Bars represent mean. *, p<0.05; **, p<0.01, one-way ANOVA, n = 3.
