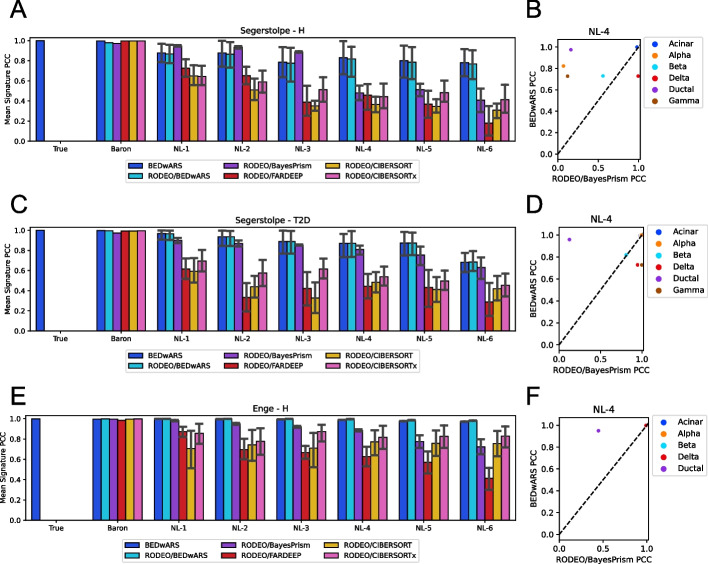
Fig. 3.
Evaluation of cell type signature estimation using pancreatic transcriptomic profiles. A, C, E Pearson correlation coefficient (PCC) between true and estimated cell type signatures, averaged over cell types, is shown for different deconvolution methods. Signatures were estimated by deconvolving 100 pseudo-bulk samples generated from Segerstolpe-H (A), Segerstolpe-T2D (C), and Enge (E) datasets. Performance of BEDwARS is compared with RODEO provided with cell type proportion estimates obtained using BayesPrism, CIBERSORT, CIBERSORTx, FARDEEP, or BEDwARS. Category labels of bar charts indicate the reference signature used. Category label “True” indicates that the true signatures were provided as reference to BEDwARS; no comparisons are made to RODEO in this case, rather this setting was used to assess if BEDwARS, which allows the estimated signature to deviate from the given reference, reports back an estimated signature similar to the true signature. BEDwARS is more robust to the increasing noise levels in recovering the true signatures in all datasets. RODEO provided with BEDwARS-estimated cell type proportions performs as well as BEDwARS, suggesting that accurate proportion prediction by BEDwARS is key to accurate signature estimation. B, D, F PCC for each cell type separately is compared between BEDwARS and its closest competitor (excluding RODEO/BEDwARS) for respective datasets, when using NL-4 signatures. In this setting, the PCC is substantially higher for BEDwARS-estimated signatures of ductal cell type than its competitor, for all datasets

