
Figure 3.
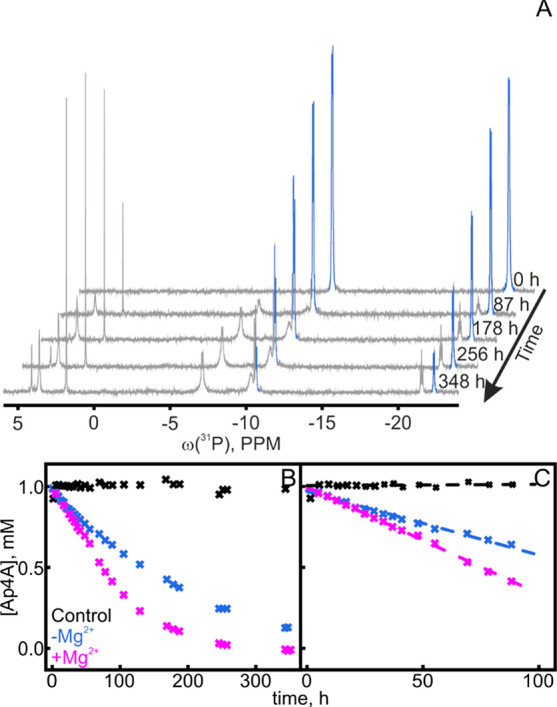
Hydrolysis of AP4A by AdK in the presence/absence of Mg2+ ions. (A) 31P NMR spectra of 1 mM AP4A at different time points from the addition of 200 μM wild-type AdK show a decrease of AP4A peaks (blue; 31P chemical shifts AP4Aα,α′ = −11 ppm, AP4Aβ,β′ = −23 ppm), but an increase of all other peaks, e.g., for AMP (+4 ppm), free phosphate (+2 ppm), ADPβ (−6 ppm), and ATPβ (−21 ppm). Full assignment is shown in Figure S4. (B) The AP4A concentration was determined from peak area integrals in the absence (blue) and presence of 2 mM MgCl2 (pink) and as control without the enzyme (black). The first 100 h is enlarged in (C), where dashed lines represent linear fits to these first 100 h, thereby indicating an initial decay velocity of 6.6 μM AP4A/h with Mg2+ and 3.9 μM AP4A/h without Mg2+. One replicate (n = 1).