Abstract
Objective
Coronavirus disease 2019 demonstrated the inconsistencies in adequately responding to biological threats on a global scale due to a lack of powerful tools for assessing various factors in the formation of the epidemic situation and its forecasting. Decision support systems have a role in overcoming the challenges in health monitoring systems in light of current or future epidemic outbreaks. This paper focuses on some applied examples of logistic planning, a key service of the Earth Cognitive System for Coronavirus Disease 2019 project, here presented, evidencing the added value of artificial intelligence algorithms towards predictive hypotheses in tackling health emergencies.
Methods
Earth Cognitive System for Coronavirus Disease 2019 is a decision support system designed to support healthcare institutions in monitoring, management and forecasting activities through artificial intelligence, social media analytics, geospatial analysis and satellite imaging. The monitoring, management and prediction of medical equipment logistic needs rely on machine learning to predict the regional risk classification colour codes, the emergency rooms attendances, and the forecast of regional medical supplies, synergically enhancing geospatial and temporal dimensions.
Results
The overall performance of the regional risk colour code classifier yielded a high value of the macro-average F1-score (0.82) and an accuracy of 85%. The prediction of the emergency rooms attendances for the Lazio region yielded a very low root mean square error (<11 patients) and a high positive correlation with the actual values for the major hospitals of the Lazio region which admit about 90% of the region's patients. The prediction of the medicinal purchases for the regions of Lazio and Piemonte has yielded a low root mean squared percentage error of 16%.
Conclusions
Accurate forecasting of the evolution of new cases and drug utilisation enables the resulting excess demand throughout the supply chain to be managed more effectively. Forecasting during a pandemic becomes essential for effective government decision-making, managing supply chain resources, and for informing tough policy decisions.
Keywords: Coronavirus disease 2019, decision support system, artificial intelligence, medical logistic planning, public health
Introduction
The novel coronavirus disease 2019 (COVID-19) outbreak was declared a global pandemic on 11 March 2020 by the World Health Organization (WHO). 1 Its expansion has triggered an unprecedented pandemic emergency worldwide,2,3 showing that the different countries were unprepared. 4 The spread of the disease has emphasised the significance of quickly recognising new epidemic clusters and patterns, while ensuring the adoption of local risk containment measures, and providing the necessary healthcare support to the population.5,6
Many works have analysed key concepts and issues like virology, pathogenesis, symptoms and clinical manifestations, diagnosis, complications 7 and treatment. 8 They have focused their attention on the spatial inequalities of COVID-19 in different countries and regions.9,10 But the lack of foresight and prevention was probably one of the most significant issues encountered during the early stages of management of the COVID-19 outbreak. Despite the existence of developed international documents on the system of measures in handling public health events and emergencies, such as the International Health Regulations (IHR-2005) to protect the population from the spread of infectious diseases, 11 the coronavirus infection demonstrated the world community's inconsistency inadequately responding to biological threats on a global scale. 12 To contain the spread of COVID-19, countries worldwide implemented a variety of initial measures, including quarantine measures, 13 large-scale restrictions on people's mobility and international passenger traffic. 14
The lack of a powerful tool for assessing various factors in the evolution of the epidemic situation and its forecasting meant that no country in the world could predict the development of the epidemic on its territory and avoid negative economic, medical and social consequences. 12 To overcome the limitations faced during the initial phases of the pandemic, several initiatives were launched to provide the necessary tools for pandemic control. One of these initiatives consisted of developing decision support systems (DSS) 15 to assist policymakers in taking effective decisions for the management of infectious disease outbreaks. 16 In this context, knowledge-based DSS systems are ensured to provide more accurate decision-making by successfully using timely and relevant data, information and knowledge management with prediction and suggestion techniques to aid decision-making. 17
DSSs have been developed during the COVID-19 pandemic focusing on different aspects of the pandemic and providing solutions to enable responses related to geospatial distribution of the infection, supply chain management and prediction of trends and epidemic peak detection. Werner et al. (2022) proposed the generation of spatial-temporal diffusion models for the identification and prediction of COVID-19 evolution in Poland by integrating epidemic models with spatial interaction models. 18 Samany et al. (2022) advanced a set of geospatial guidelines used for the definition of reliable protocols for COVID-19 management systems and outbreak control. Their study evaluated the most suitable techniques of statistical methods, predictive models, geographical information system (GIS)-based solutions and emerging technologies applicable to decision-making tools. 19 Lei et al. (2019) researched the dynamic trend of risk transmission within the transnational supply chain to prevent the spread of risks. They proposed an improved susceptible-infectious-susceptible (SIS) model combined with a complex network model and an optimised approach to the selection of risk control strategies. 20 Sawik (2022) suggested scenario-based stochastic mixed integer programming models and a multi-portfolio approach for the optimisation of supply chain operations under ripple effect. Use cases using examples modelled in part after real-life pandemic scenarios were provided to evaluate optimal solutions for resilient and non-resilient supply portfolios. 21
This paper presents a novel DSS system named Earth Cognitive System for COVID-19 (ECO4CO). It is a service that provides end-users (authorities, civil protection, the scientific community, etc.) with notifications, warnings and timed and geo-localised communication services, covering potential risk areas, criticalities regarding facilities or medical storage and crowd movements. Its main objective is to counter the spread of the COVID-19 pandemic and provide rapid insights and evidence of geolocalised events, that may impact the evolution of outbreaks.15,22,23
The ECO4CO service was developed by a consortium of industrial and research partners, including Telespazio S.p.A, e-GEOS S.p.A, Leonardo S.p.A, LINKS Foundation (formerly ITHACA), CherryData S.r.l, and the Sapienza University of Rome, as part of a demonstration project co-funded by the European Space Agency's (ESA) Business Applications programme. Demonstration Projects are pre-operational demonstration services implemented as part of the ESA Business Applications programme. 24 These services profit from the combined use of one or more space assets, such as earth observation, satellite navigation, and satellite telecommunication, and they have the potential to be long-term sustainable. The project comprises a pilot phase to implement the ECO4CO service and test it in real-world scenarios.22,24
The system relies on Geospatial artificial intelligence (AI) and the ingestion of several heterogeneous datasets to implement a knowledge-based system that is a tool to deliver intelligent decisions by using GISs, data mining of geospatial data and AI methods. 25
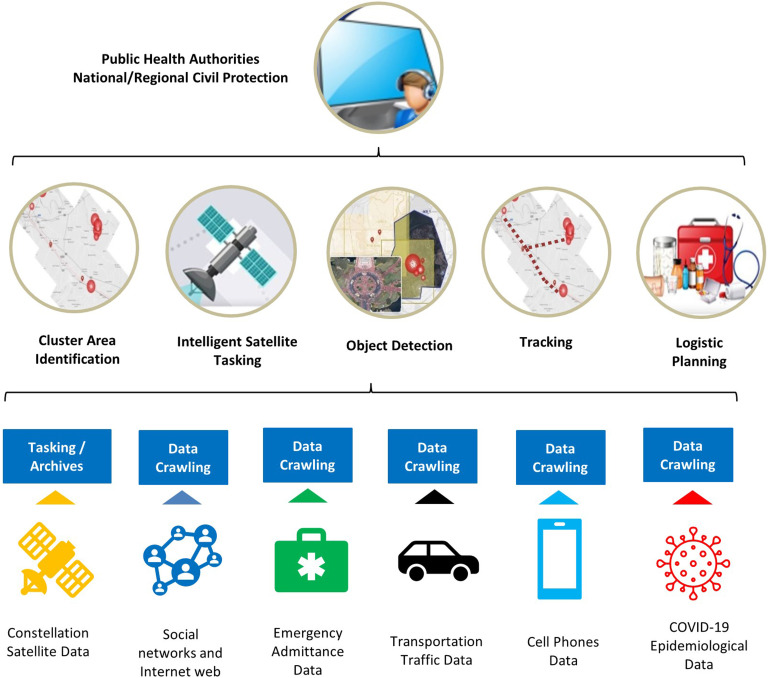
In Figure 1, a high-level system architecture is presented: Heterogeneous data, such as social networks, business intelligence data, emergency room attendance data, information on transportation traffic and so on, are ingested into the system using web crawlers, which are software for automatically downloading web contents. 26 This information is processed independently by several standalone sub-services, which are classified into Cluster Area Identification, Intelligent Satellite Tasking, Object Detection, Tracking and Logistic Planning (LP). Each sub-service generates warnings and alarms which are displayed on a unique Graphical User Interface (GUI).
Figure 1.
Earth Cognitive System for Coronavirus Disease 2019 (ECO4CO) service description.
The system uses social media to identify cluster areas where an outbreak might have occurred by analysing and aggregating tweets containing COVID-19-related keywords, and automatically triggers satellite image acquisitions. In this way, Twitter data is used to suggest to the user which geographical area needs particular attention and dedicated monitoring and can be used as a source of disease surveillance and hence can bypass formal information channels and enhance the response speed of control measures. 16 On the other hand, Twitter is a valuable source of data for identifying ‘hot spots’ and assigning remote-sensing data acquisition tasks. 27 Satellite images detect features that indicate crowding by seeing vehicles in parking lots. The identification of vehicles and counting them using satellite images is an approach commonly used in monitoring traffic and transportation systems 28 and other applications involving the development of parking space availability models. 29 Likewise, the aggregation of persons in the streets and squares is detected by analysing the number of persons nearby using street surveillance cameras.
The system also uses tracking of traffic and people's movement between different areas to assess the possibility of spreading the disease. Mobile phone data, in particular, are provided by mobile operators in the form of aggregated and anonymised data, which can help identify the transit of specific categories of people in mobile cell areas. Simultaneously, sensor information from Road traffic monitoring operators is gathered from monitoring road traffic between various places and from checking parking lots crowding.
The coordination of the response actions by clinical teams and the health service authorities to potentially arising critical situations due to new outbreak cluster identifications is supported by providing medical logistics information, and predictions of new infections, hospitalisations, and intensive care saturation. This information is generated by a particular module called ‘Logistic Planning’, which uses predictive data analytics to identify the future trends of the pandemic indicators and parameters in order to match them against future medical supply needs.
This paper focuses on the LP subservice of the ECO4CO platform whose objectives are (a) to create integrated databases (DBs) about health and the use of health services to facilitate descriptive analyses and forecasting; (b) to develop a novel model of DSS for epidemic spreading control, and (c) to assess the performance of the model in terms of predictivity. According to these objectives, the paper presents a set of models that enable near-real-time analyses of the COVID-19 disease's epidemiological spread and trends and its geographic distribution. AI models are used to predict key parameters that have a direct impact on the management of the resources used by public health authorities to counter the spread of COVID-19. The parameters of interest are the attendances to the emergency departments, the number of new positives, the number of hospitalised and intensive care patients, regional risk classifications and the needed pharmaceutical resources. Finally, the paper presents a validation of the results obtained from the AI models using real-life scenarios data that were gathered automatically from official sources and shows the usefulness of such system to the health authorities.
Methods
The development of the ECO4CO platform involved a multidisciplinary team of industrial and research partners from different fields including space, engineering, geography and the medical sectors. The LP was developed by Telespazio S.p.A and it involved, particularly the Policlinico Umberto I Hospital and several departments from the Sapienza University of Rome: The Sapienza Information-Based Technology InnovaTion Center for Health (STITCH), the Department of Public Health and Infectious Diseases, the Department of Medico-Surgical Sciences and Biotechnologies, the Department of Letters and Modern Cultures and the Department of Mechanical and Aerospace Engineering.
This paper presents the LP sub-service as a matter of relevance to the clinical management of the pandemic. To develop the ECO4CO system and the LP module, interactions were made with medical and public authorities such as the Piemonte (Piedmont) region authorities and clinicians from Umberto I Hospital of Rome in the Lazio region (Italy). These encounters were helpful in the definition of specific needs and requirements in the management of the COVID-19 epidemic. These requirements were then translated into system requirements and were also the basis for the technology selected for the system.
The reference users indicated the necessity of a service that allows to analyse and predict the epidemiological spread and trends of the COVID-19 virus in near real-time against its geographical distribution, as well as monitoring medical data information trends provided by health authorities to identify critical areas and predict the time course of the epidemiologic evolution. 22
The technological inputs, processes, and mechanisms of interest used in the context of the present DSS consist in the use of Geospatial AI using the combination of the following items: 30 web-based and state-of-the-art-centralised cloud computing and collection of data using web-crawlers (official health and epidemiological data); AI prediction tools for pandemic evolution forecast and detection of cluster outbreaks; geospatial tools to allow the user to interact with the service and its customisation allowing the selection of areas of interest and time frames; and a user-friendly dashboard for integrated and interactive geographical representation of data, analysis outputs and trends.
The AI prediction implementation is based on the python ML/DL framework and libraries such as pandas, scikit learn, tensorflow, and keras. The DBs are based on PostgreSQL and PostGIS extension for the geospatial elements. On the other side, the data without geographic information is stored on MongoDB. The implementation of the LP service is based on the microservices paradigm. Each microservice is containerised into a docker image and is orchestrated by the kubernetes cluster.
The outcomes of the system to the users, and in particular health authorities, is a multilayer dashboard providing specific warnings which are triggered when forecast parameters exceed predefined thresholds. The predictions and warnings are related to:
The regional risk classification colour switching.
The trend of new COVID-19 positives at regional level.
Non-critical hospitalisations at regional level.
Attendances to the emergency rooms of the monitored medical sites.
Procurements of medical supplies at regional level.
These outcomes were selected because they give clear indications of the demand and supply for medical intervention at the regional level and can help regional health authorities to take the necessary actions beforehand when increases are foreseen in the use of hospital beds and medicines.
Several interactions with clinicians from the Sapienza University of Rome's Umberto I Hospital took place during the service's design and testing phase to assess the medical implications of the LP sub-service outputs and their role in the decision-making process, as well as to direct the system's design to allow for the interpretation of data that can be useful in the orientation of the health system response to shifting scenarios. 22
Artificial intelligence
DSSs that provide adequate support to Health Authorities must rely on models which provide the ability to correctly fit and forecast epidemic trends and allowing to predict future outbreaks. 31 Several epidemic models have been used in the literature to predict epidemic peaks and forecast future trends. Vytla et al. (2020) have enumerated three types of epidemic models: Statistical-based models, mechanistic state space models and empirical/machine learning models. 32 Statistical models can rely on statistical regression models such as the Gaussian model, where the dynamics of the epidemic outbreaks are identified with time series of the identified infected cases. State space models, also referred to as traditional mathematical models, 33 describe the dynamics of the epidemic using differential equations by subdividing the population into several categories. These models include the susceptible-infected (SI) model, SIS model, susceptible-infected-recovered (SIR) model, the susceptible-exposed-infected-recovered (SEIR) model, etc. Machine learning methods can include different types of models such as linear regression models, polynomial regression models, support vector machine learning, artificial neural network (ANN) models, etc. 33
In the literature, several research works have been based on the abovementioned models in the context of COVID-19 pandemic. The IHME (2020) used an SEIR model for the forecast of critical driving covariates such as pneumonia seasonality, mobility, testing rates and mask use per capita and as well as the assessment of scenarios involving social distancing and facial mask use. 34 Kuvvetli et al. (2021) proposed a study to predict the daily number of patients, and the daily number of fatalities in several countries based on ANN, deep learning and long short-term memory (LSTM) methods. 35 Kolozsvári et al. (2021) applied recurrent neural networks (RNNs) with gated recurring units (LSTM units) to create two prediction models developed using publicly available datasets from the WHO and Johns Hopkins University. 36 Yang et al. (2020) used two models based on a modified SEIR model and an LSTM RNN model to derive the epidemic curves based on population migration data and COVID-19 epidemiological data. 37 Pourhomayoun et al. (2021) developed models to help medical facilities in their task of prioritising the hospitalisation of COVID-19 patients avoiding overwhelming of the health system. They used a selection of machine learning methods such as support vector machine, ANNs, random forest, decision tree, logistic regression, and K-nearest neighbour (KNN) to predict the mortality rate of COVD-19 patients. The results obtained showed at least 89.98% overall accuracy. 38
The approach adopted in predicting the parameters of interests is based on several types of Machine Learning algorithms, which include RNN, KNN methods, and linear regression algorithms. While the RNN technique was used in previous work to predict the new positives, 36 and the KNN method was used to forecast the mortality rates of COVID-19 patients, 38 in the present paper these techniques (RNN and KNN) are used to extend the prediction to several factors such as the case for the RNN networks with LSTM layers to predict the new positives, the number of patients being hospitalised in non-critical conditions and the number of patients in intensive care. These parameters are used to predict a risk classification colour code indicating the severity of the COVID-19 emergency state at the regional level. In some instances, KNN networks are also used to forecast the latter. In addition, regression techniques are used to evaluate the attendances to the emergency wards belonging to the medical structures of the Lazio (Latium) region in Italy and the predicted purchased quantity of medicines per region. These parameters are relevant in the context of COVID-19 as they describe the dynamics of the pandemic, which impact the management of the response and the use of the available resources in terms of medicines, facilities and hospital beds.
ANN are a branch of Machine Learning used for decades in healthcare research, particularly for categorisation applications such as predicting the likelihood of a patient developing a specific disease. 39 ANNs emulate biological brain structures and consider problems in terms of neurons composed of inputs, outputs, hidden processing units and variable weights that link inputs and outputs throughout the hidden units. During the training phase, a network is able to learn the different features’ weights that contribute to determine a specific output and automatically remove unnecessary and redundant information from the data stream in order to improve its predictive performances.
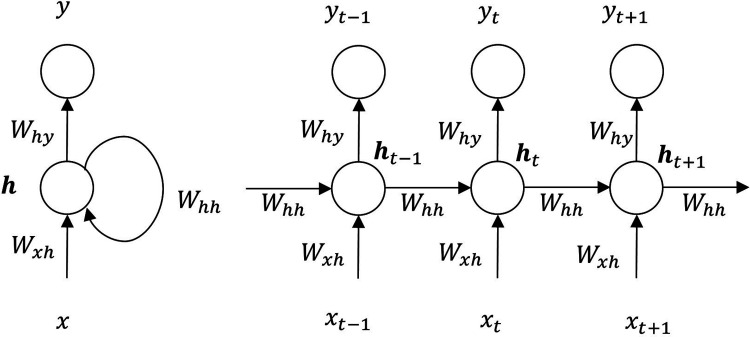
RNNs are a type of ANN that are often used in the prediction of sequential data or time series data. 40 These ANN have recurrent connections that can represent sequential data for sequence recognition and prediction. 41 In these types of networks, the hidden units include a built-in feedback loop that allows its state to be transmitted back to the same node several times. These internal loops cause recursive dynamics in the networks, introducing delayed activation dependencies throughout the network's processing elements. 42 To train the weights of an RNN, backpropagation through time is often used 43 which is a modified version of the backpropagation method that is based on the gradient descent.
Figure 2 represents an example of an RNN with one hidden unit. The left-side figure represents the recursive description of the RNN and the right-side figure is the extended RNN model in a time-sequential manner.
Figure 2.
Example of a recurrent neural network (RNN) with one hidden unit.
A common issue in RNNs related to vanishing gradients is the short-term memory. The main side effect is that short-term events have a higher influence on the hidden layers compared to long-term ones, and this might bias the forecast, especially in the case of recurrent and seasonal phenomena.
To overcome this limit, a particular type of RNN is used: LSTM, standing for Long-Short-Term-Memory. This kind of network has a particular set of nodes dedicated to keep in consideration also records further back in time, which is helpful in situations like the study of epidemic spreads as they tend to have a repetitive pattern over time.
The core concept relies on the idea that information from the earlier time steps can make its way to later time steps, reducing the effects of short-term memory.
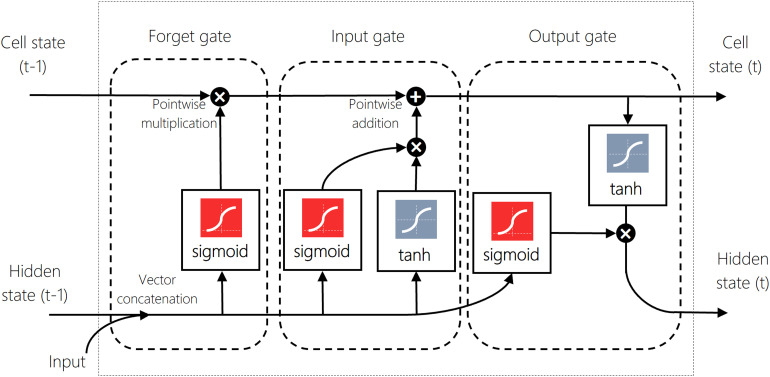
Figure 3 depicts an example of an LSTM cell. As the LSTM Network processes training data, information gets added or removed. There are inner neural networks (gates) that learn and decide what information is relevant to keep or forget during training. In particular, the Forget gate decides what is relevant to keep from prior steps, the input gate decides what information is relevant to add from the current step, and the output gate determines what the next hidden state should be.
Figure 3.
Example of an LSTM cell. The Hidden State is a representation of the previous inputs. It retains information from one time step to another during the RNN flow. The Cell State represents the long-term memory of the model. LSTM: long short-term memory; RNN: recurrent neural network.
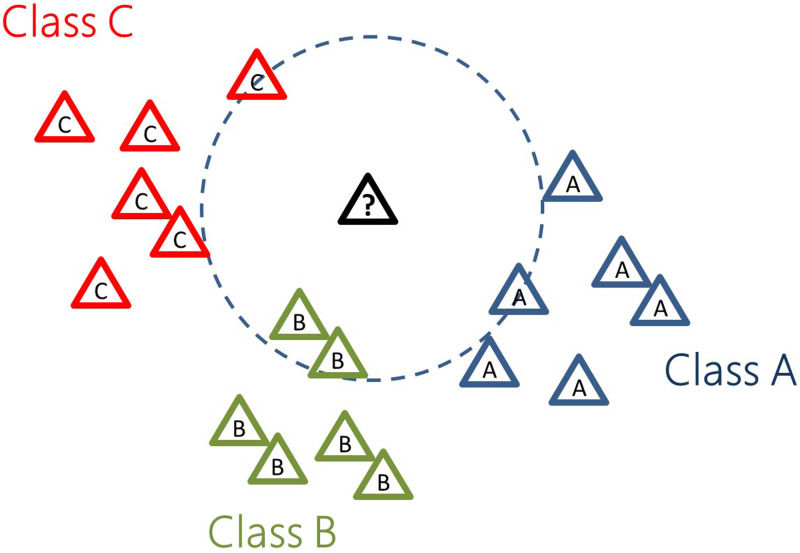
KNNs is an algorithm that classifies new data using a similarity measure, which commonly is a distance function, to previously recorded samples. 44 KNN is a non-linear model, meaning that the parameters used to predict a label are not based on the use of a line (or a hyperplane in case the model uses more than two parameters). These algorithms are based on the assumption that elements which are similar are generally close to each other. As a nonparametric pattern-classification technique, the algorithm relies on finding the k-training examples closest in Euclidean feature space to an unknown feature as conceptually represented in Figure 4. The class label of these k neighbours is then assigned to the unknown pattern. 45
Figure 4.
A k-nearest neighbours (KNN) classifier.
Moreover, KNN is an extremely powerful algorithm because it can be used both for regressive and classification purposes, making it adaptable to different scenarios with great results.
Regression modelling is a method extensively used in statistical studies which has found a broad application also within machine learning tasks. Overall, regression models estimate a dependent variable (y) in relation with the value of one or more independent variables (x). 46 The choice of a proper regression model and the right variables represent a crucial step to achieve the desired results: the use of a wrong model or inappropriate variables may lead to important inaccuracies. Linear regression is a type of regression modelling where linear relationships between one or more factors can be found and expressed in a simple mathematical form. This technique is used to predict data and to investigate causal relationships between the dependent variables and a set of fixed independent variables in a dataset. 47 For continuous dependent and independent variables, the strength of the association between these variables can be measured using a correlation coefficient. 46
Medical input datasets
The LP collects data from a variety of health sources, which include:
Emergency Departments attendances.
Medical supplies purchases at regional level.
Colour coding of administrative regions for COVID-19 classification.
Numbers of daily infections, recoveries, and fatalities at regional level.
Numbers of non-critical hospitalisations and intensive care bed occupancy at regional level.
In order to use these data successfully with AI techniques in the management of COVID-19, a considerable volume of high-quality data is required 48 and needs to be ingested by the algorithms in an automatic way and on a regular basis. In our case, the datasets used are obtained from the Italian national and regional public administration, which disseminates the information in open formats (open access data) to allow greater transparency and provide better access to information to the citizen. 49 The open data allows information to be re-processed and used to create innovative services: Individual citizens and businesses can transform public administration DBs into services such as apps for mobile devices both abroad and in Italy. 49 Particularly, the data used during the project were obtained in several electronic format such as json, comma separated values (csv) and html tables from the relevant administrations’ websites that were updated on a regular basis.
The Lazio region health system provides open datasets that report in real-time the accesses to Lazio's Emergency Departments about every hour. On the basis of the emergency conditions, the level of severity, and the priority, each patient is assigned a triage code, corresponding to their condition. 50 The dataset consists of the number of people attending the emergency rooms according to their triage code in every hospital belonging to the region.
The number of medical structures covered by the dataset is around 48. The average number of attendances varies according to the structures and can go between a few patients to over a hundred patients as shown in Figure A1 in the Supplemental materials. About 90% of Lazio patients are treated in 27% of the medical structures available in the region. The population of the Lazio region, serviced by the regional health service, reached about 5,730,399 in the year 2020 51 and is distributed according to 10 health districts denominated Azienda Sanitaria Locale (ASL). The distribution of the population according to ASLs is shown in Figure A2 in the Supplemental materials.
The available medical supplies regarding COVID-19-related medicines and equipment are obtained from the Italian Medicine Agency (AIFA). AIFA is the national public authority in charge of regulating human-use medications. AIFA controls pharmaceutical spending and monitors the life cycle of medicines to assure their efficacy, safety, appropriateness, and national territory access. 52
The regional risk classification colour coding (Red, Orange, Yellow and White) and the number of daily infections, recoveries, and fatalities at the regional level are obtained from the Italian National Civil Protection datasets. 53 The data are updated daily and are provided to the National Civil Protection by the Italian Administrative Regions. 53
The dataset describing the COVID-19-related non-critical hospitalisations and intensive care beds occupancy for each administrative region is obtained from The National Agency for Regional Health Services (AGENAS). The agency is a technical-scientific body of the Italian national health system carrying out research activities and supporting the Ministry of Health. 54 Their published data is updated daily.
To support the present study, additional information on the demographics of the Italian regions 55 can be found in Figure A3 in the supplemental materials. Figure A3 represents the population distribution of the Italian regions in the year 2019. 55
The logistic planning system and processes
The LP sub-system runs in a cloud environment. It uses several sub-modules and DB components to perform several processes, from online data ingestion to alarm generation.
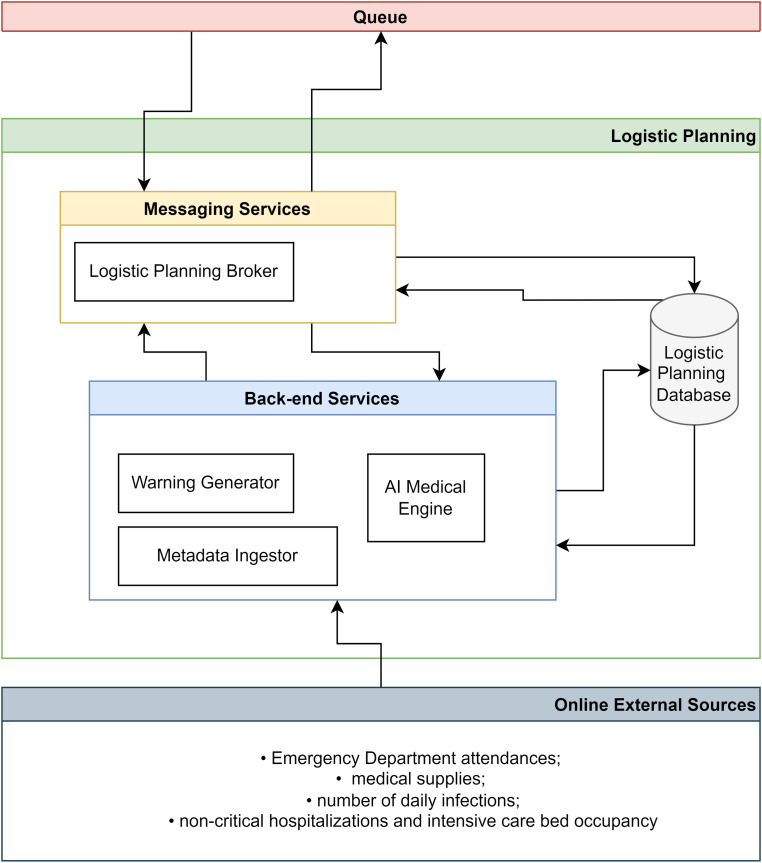
Figure 5 depicts the internal logical architecture for the LP service. The metadata ingestor is a module responsible for gathering data from external medical sources. It handles the ingestion of elements metadata. It provides ingestion capabilities polling on configurable input basket directories and searching for relevant files to be parsed. The LP DB is responsible for storing medical data in a persistent DB.
Figure 5.
Logistic planning internal architecture.
The AI medical engine analyses the medical data in the LP DB using machine learning algorithms (RNNs, KNNs, and linear regression) to perform data analysis and trend predictions. The warning generator is a module responsible for collecting potential elements identified by the AI medical engine component and generating the message to be dispatched through the LP Broker. The latter is responsible for dispatching warnings determined by the warning generator component and sending them to the message service layer, to be received and analysed by a GUI sub-system through a queue system.
LP operates by retrieving every night updated data related to the number of new positives, fatalities, hospitalised patients and patients in intensive care. 22 A dedicated task is launched every Monday night, to process these parameters. Each feature trend is predicted over the next seven days using a RNN that incorporates LSTM layers. All the networks consider a training time window of the three previous weeks for each feature in the training process. In this way, the models are given sufficient retention of past occurrences while being allowed to adapt quickly to new and unforeseen changes such as the emergence of new variants.
Those three predictions are used along with the Italian government's parameters to calculate the colour code of the regions and are therefore used to derive the predicted colour code.
Considering that the regional colour calculation system was updated in June 2021 by the Italian government, this colour prediction model is only applied to data collected after that date. 22 A KNN classifier was used in the months before that date. Such a model is also based on the number of weekly positives, newly hospitalised patients and ICU patients and automatically learns how to predict the colour code. In this way, the model was parameter-agnostic as it used the same parameters. Still, without any known criteria to set a colour code: this avoided the introduction of excessive bias while testing the LP service during the first months of 2021.
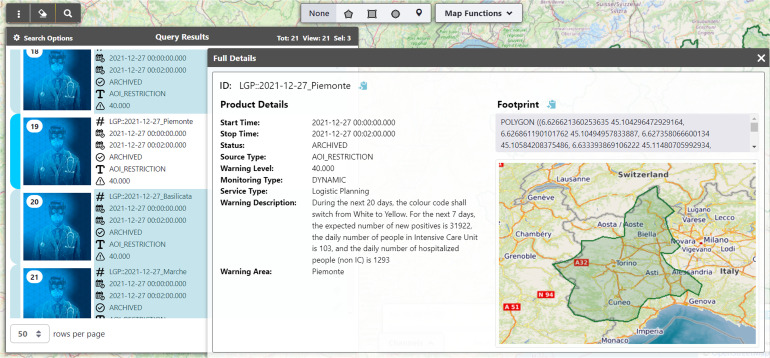
The final output is a warning informing the user of the expected colour code of a specific administrative region for the following weeks. The generation of warnings takes place every week for all regions. For example, Figure 6 depicts a warning generated by the ECO4CO platform describing a regional colour code switch for the Piemonte (Piedmont) region from white to yellow. It also indicates the predicted values regarding the number of new positives, the number of patients in intensive care units (ICUs) and the non-critical hospitalisations.
Figure 6.
Example of Logistic Planning warnings (Regional risk classification colour code switch).
The predicted emergency room attendances are computed using a process that collects every two hours updated data from the Emergency Departments of the Lazio region's medical structures (about fifty structures). The data is averaged over a configurable time window (a 4 h-time window width was chosen) and fed into a linear regression algorithm, 22 which determines the average number of emergency room admittances over the next 4 h. For each forecast, the model considers the previous 24 h as it was found that extending the time window over that period reduces the forecast precision. Warnings are ingested in the platform every 4 hours, regardless of the severity of the predictions to provide users with a real-time picture of Emergency Department attendances and let experts organise the efforts and resources at their best a few hours in advance.
Lastly, the amount of units acquired by an administrative region for each medicine over the next month is predicted by a KNN regressive model. A warning is generated for that region if some forecasts exceed a threshold value. Medicine purchase quantities are updated every month by the relevant national agency—a dedicated job checks for data updates multiple times per month. Every time new values are available, another sub-module processes this information and predicts the amount of medicine purchased for every region. If the forecast of one or more medicines exceeds a growth rate threshold, the system will generate a warning for that region listing all the drugs that might be required during the next 30 days. Within the warning, further details are available, like the number of medicine boxes per 100,000 inhabitants needed during the next month.
The warnings are saved on the ECO4CO platform regularly, together with geographical and temporal information, so that users can trace the progression of alarms and discover new alarms while querying the system.
Statistical analysis
The accuracy of the prediction models was measured by comparing the predicted values against the real values , that were systematically collected during the pilot phase. Real and forecast data indicating the number of new positives, intensive care and non-critical hospitalisations were collected between March 2021 and January 2022. Real and forecast colour code classes for the Italian administrative regions were recorded for the period between March 2021 and January 2022. Real and forecast values of the attendances to the Lazio region's emergency rooms were collected between February 2021 and July 2021. Finally, real and predicted medical stock purchases for two Italian regions (Lazio and Piemonte) were recorded for the years 2019, 2020 and 2021.
The metrics used to evaluate timeseries predictions are the mean absolute errors (MAE), root mean square errors (RMSE), root mean squared percentage error (RMSPE) and the Pearson correlation coefficient (R2). The validation of the regional colour code classification was based on the assessment of a confusion matrix, 56 which records correctly and incorrectly predicted colours for each colour class as described in the Supplemental materials. The performance metrics used for the evaluation of the multiclass confusion matrix were accuracy, recall, precision, and in particular the macro average F1-score. Their significances are described in the Supplemental materials. Microsoft Excel was used for the tabulation of the output of the LP data and their analyses.
The data and inputs used by the models have been more than once discussed by the multidisciplinary team of the ECO4CO project in order to analyse the results in detail and plan specific improvements.
Results
Continuous evaluation of system operations is required to assess the performance of the ECO4CO system, and in particular, for the LP service, a validation of the sub-service during a pilot phase test provides an opportunity to identify and enhance functional strengths and limitations. The following sections present an assessment of the different prediction models outputs generated by the LP sub-service.
Prediction of new positives, intensive care and non-critical hospitalisations
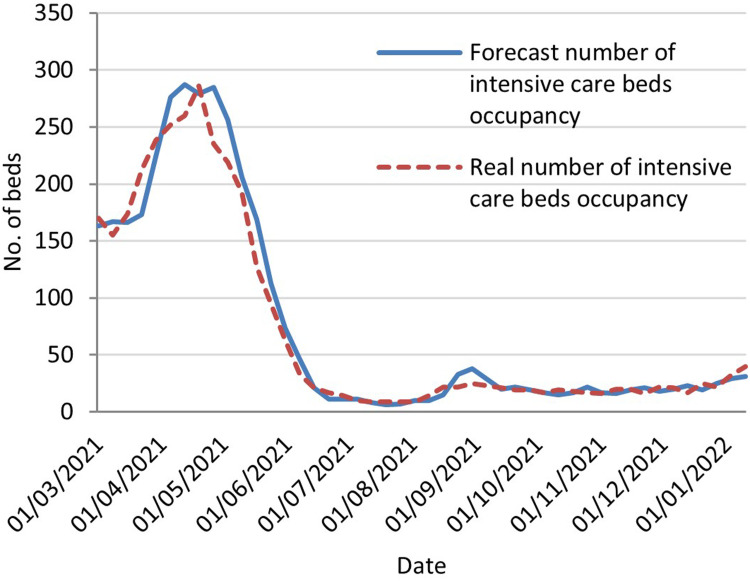
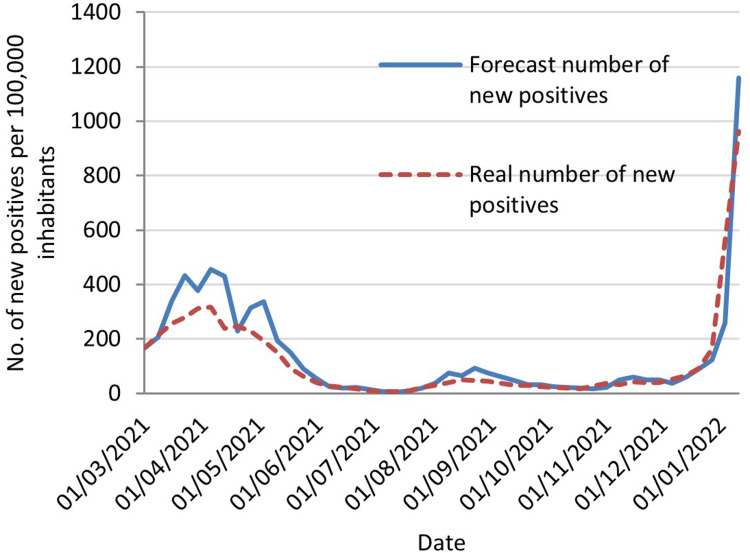
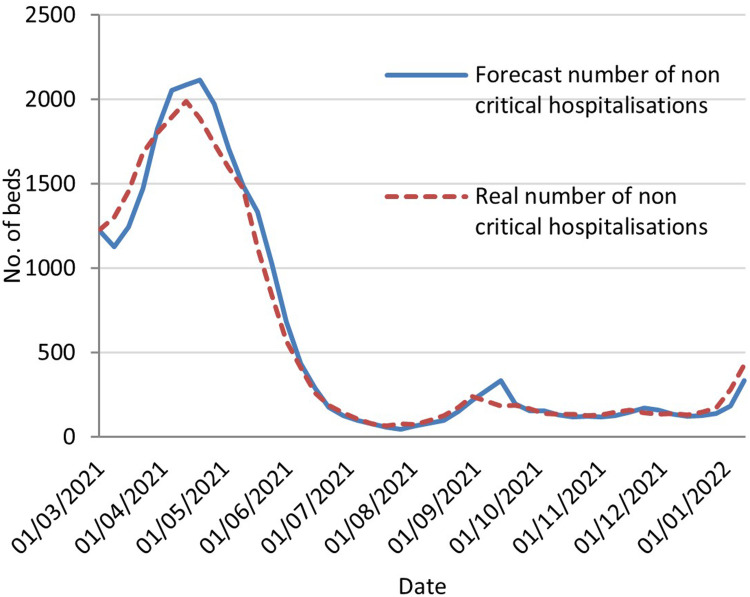
The time series examples described in Figures 7–9 represent the forecast curves compared to the actual curves of the features of interest for the Puglia region. Additional time series curves for a lower number of cases observed in the Calabria region are shown in Figures A4–A6 in the Supplemental materials.
Figure 7.
Forecast against actual number of intensive care occupancy in the Puglia region.
Figure 9.
Forecast against actual number of new positives in the Puglia region.
Figure 8.
Forecast against actual number of non-critical hospitalisations in the Puglia region.
Figures 7–9 show that the forecast trends follow the actual values narrowly. Until December 2021, the model tended to overestimate the values slightly. After the arrival of the Omicron variant, which infection dynamics were exponential-like, the model tended to follow the trend of the real values with a slight delay.
Contrary to the case of the Delta variant during the peak of April 2021, it can be observed that the predicted number of intensive care patients and non-critical hospitalisations did not rise sharply after the spread of the Omicron variant, even though the contagion rate of the Omicron variant was far higher than the Delta one. This shows that the model was able to dynamically adapt to the evolution of the pandemic, which also evolves according to the medical response and the implementation of effective and preventive measures such as the vaccination of the population.
The metric used for the evaluation of the Machine Learning performances for the prediction models is the Pearson correlation coefficient (R2). 56
The models used to predict the number of non-critical hospitalisations and intensive care patients performed very well, yielding R2 close to 1 (See Figure A7 in the Supplemental materials). The model for predicting the new positives yielded good results overall for the Italian territory and in particular for 16 regions over 20 (See Figure A8 in the Supplemental materials). Nevertheless, for what concerns the Italian administrative regions of Basilicata, Friuli-Venezia Giulia, Trentino-Alto Adige/Südtirol and Sardegna (Sardinia), the predictions suffered from the presence of few outlier peaks which deteriorated the value of R2, while for the overall R2 computed at the national level (0.826), the presence of these outliers was overshadowed by the size of the dataset. The population size could be a hidden driver of the R2 output, as the regions underperforming are all areas with smaller populations. On the other hand, the algorithms perform better in regions with a high population density.
Figure A7 depicts the Pearson correlation coefficient between the predicted and actual values of the number of new positives per 100,000 inhabitants, the number of non-critical hospitalisations and the number of intensive care patients, respectively. The metric was calculated over the entire dataset covering all the Italian regions from March 2021 to January 2022. It can be observed that the R2 coefficient yielded high values showing a high positive correlation for the first parameter and a very high positive correlation for the last two parameters. 57
Regional risk classification colour code prediction
The validation of the regional risk classification is performed by assessing the goodness of the prediction of each colour class computed from the forecast values of the number of new positives, non-critical hospitalised patients and ICU patients. The predicted colour code class (Red, Orange, Yellow, White) for each week was collected along with the actual colour class for each administrative region over a period that extended between March 2021 and January 2022. Examples of the time series of the forecast of some regions severity colour code against the actual ones published by the National Civil Protection are shown in Figures A9–A12 in the Supplemental materials.
The overall performance of the regional risk colour code classifier at the national level yielded a high value of the macro average F1-score (0.82) and an accuracy of 85%. 22
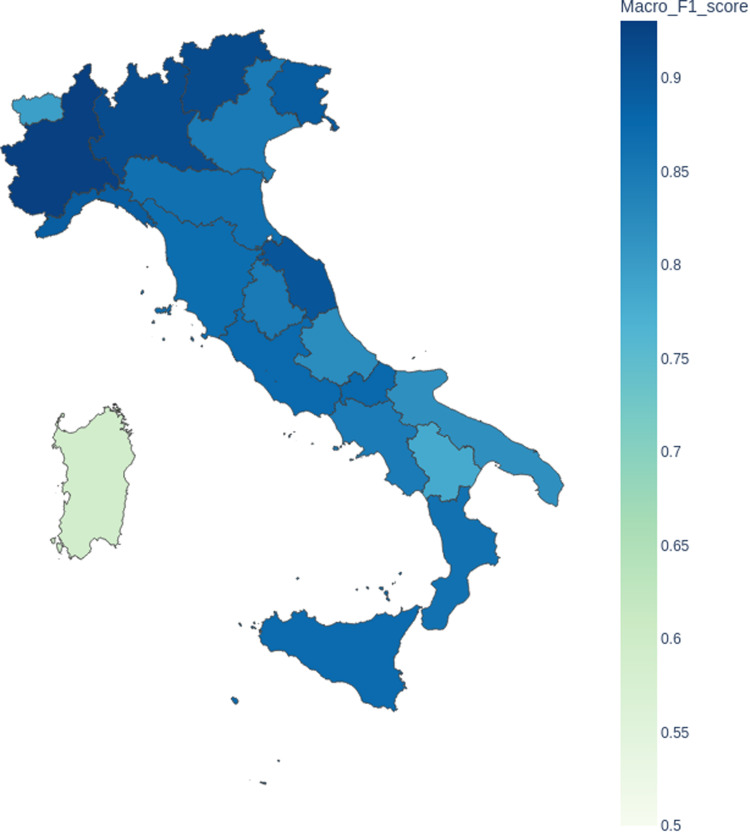
The performance metrics of the macro average F1-scores were computed at regional level and mapped in Figure 10.
Figure 10.
Regional risk classification colour code forecast macro average F1-score by region.
The administrative region where the model performed the least was Sardegna (Sardinia). The classifier yielded a macro average F1-score of 0.59 and a prediction accuracy of 71%. The macro average F1-score value was affected by the precision of the Yellow class, which was influenced by the presence of several false positives mostly during August 2021 (See Figure A10 in the Supplemental materials). Similarly, during this period, the forecast of new positives used as input in the colour code calculation suffered from outliers predictions. The administrative region where the model performed best is Piemonte (Piedmont) with a macro average F1-score of 0.93 and an accuracy of 93.3%. Overall, the number of regions with a macro average F1-score greater or equal to 0.8 is 18 over a total of 20 regions in Italy (90%), leaving only behind Sardegna (0.59) and the Basilicata region (0.78).
Emergency department attendances forecast
An example of the predicted number of patients that use the emergency rooms of the Policlinico Umberto I Hospital is shown in Figure A13 (for the period between February and March 2021) in the Supplemental materials.
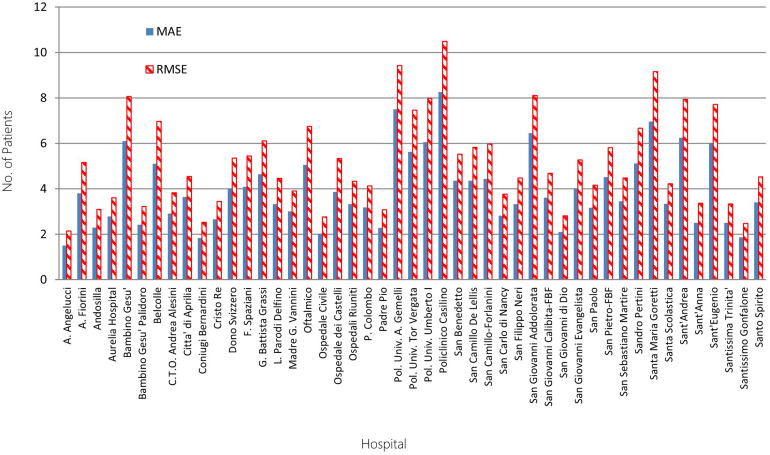
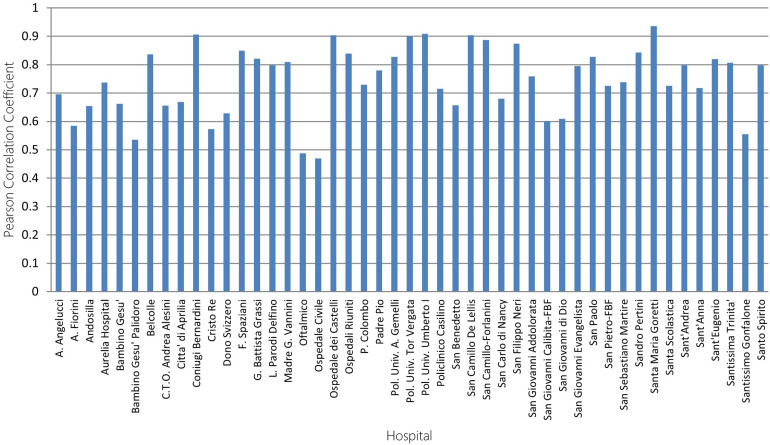
The predictive models have been evaluated by calculating the MAE and RMSEs for each hospital in the Lazio region. These metrics are displayed in Figure 11 and represent low error values (RMSE < 11 patients). The R2 coefficient was also calculated for each medical structure to assess how correlated is the predicted trend with respect to the actual one. The Pearson correlation coefficient is shown in Figure 12.
Figure 11.
MAE and RMSE of the predicted number of patients attending the Lazio region's hospitals. MAE: mean absolute error; RMSE: root mean square error.
Figure 12.
Pearson correlation coefficient.
Observing the R2 coefficient in Figure 12, it can be noticed that some structures yielded low values (less than 0.5), such as the Ospedale Civile and the Oftalmico hospitals. In fact, in such medical structures where the average number of patients is minimal (less than 20 patients, see Figure A1 in the Supplemental materials), the relative value of the estimated errors over the mean attendance value is high, even though the errors are still tolerably low, and such aspect hurts the prediction trend and the R2 coefficient. This can be observed in Figures A14 and A15 in the Supplemental materials, which depict the RMSE and R2 in relation to the average number of attendances to the emergency rooms respectively. On the other hand, for what concerns the crucial hospitals of the Lazio region, which receive the bulk of the patients in the region (90%), the RMSE is small and the computed R2 yield values higher than 0.70 (e.g., Policlinico Gemelli R2 = 0.83, Policlinico Tor Vergata R2 = 0.90 and Policlinico Umberto I R2 = 0.91). Such value (R2 = 0.70) shows at least a high positive correlation between the predictions and the actual values. 57
Medical stocks
During the pilot run of the ECO4CO service, the regions of Lazio and Piemonte were selected as the target regions for the evaluation of all the proposed services (Cluster Area Identification, Intelligent Satellite Tasking, Object Detection, Tracking and LP). During the pilot evaluation, it was possible to cross data from different sources and find correlations regarding various aspects of interest for the pandemic spread.
The medical stock purchased by both regions was collected from the Italian Medicine Agency AIFA for a period covering a pre-pandemic interval during 2019 and a post-outbreak interval between 2020 and 2021. In such a way the dataset would contain several types of scenarios ranging from ordinary pre-pandemic usage of medicinal equipment to extraordinary consumption during the evolution of the pandemic (peak and non-peak phases).
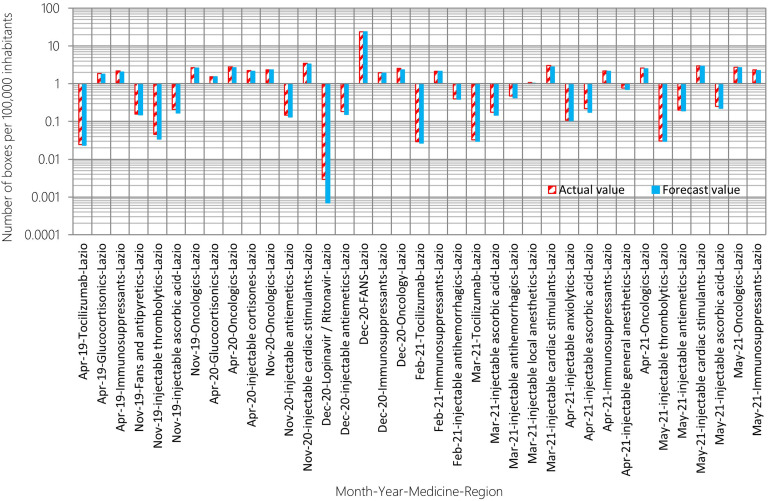
Figure 13 shows, using the logarithmic scale, the comparison between the actual pharmaceutical purchase and the predicted one for the Lazio region that resulted in warnings generated by the LP system in the months of April 2019, November 2019, April 2020, November 2020, December 2020, February 2021, March 2021, April 2021 and May 2021.
Figure 13.
Comparison between forecasts and real pharmaceutical stock procurements for the Lazio region. The horizontal axis reports the considered month, year, medicine and area.
It can be observed that the model correctly estimated the consumption of different types of medicinal stocks and equipment. For both the Lazio and the Piemonte regions, the model mapped the medical stock procurement trend during the warnings generated by the LP service with a RMSPE of 16%. 22
Discussion
The study allows to facilitate the descriptive analysis and forecasting of key parameters using AI models useful for the prediction and forecast of the dynamics of the pandemic. The development of the models has enabled thanks to the availability of a large quantity of medical data from official public health sources. According to the objectives set by the study, the development of the LP platform relies on the continuous analysis of the data for the generation of alarms as a result of near real-time analyses and regular and automated data acquisition.
In the early stages of the pandemic, the use of AI to build epidemic models faced particular caution due to the lack of sufficient data and the excessive presence of noise and outliers in relation to big data collection from unreliable sources. 58 Nevertheless, a lot of efforts have been made since, to enable access to data from official health authorities’ digital platforms, facilitating collection and automation of processes related to epidemic data modelling, and providing more reliable data. In this context, the proliferation of official open-access data created a thriving landscape for the use of AI in epidemic modelling and its use in the framework of DSSs.
Today, the availability of COVID-19 surveillance data in terms of daily and cumulative numbers of cases, deaths, and recoveries is no longer an issue and traditional mathematical models such as the SIR, SEIR and Stochastic models describing the dynamics of the epidemic were used in several research and were demonstrated to provide good forecasts. Predicted numbers of infected individuals using the standard SIR method against effective numbers for several countries were reported with relatively small errors ranging from 1.1% (USA, France) to 3.9% (Spain). 59 An Autoregressive Integrated Moving Average (ARIMA) modelling was used instead to project the prevalence of COVID-19 patterns in East Africa Countries. The author found relatively small forecast errors yielding mean absolute percentage errors of less than 4%. 60 The key parameters predicted by the AI models in the present study represent a broad set of items chosen to provide a comprehensive picture of the COVID-19 emergency in terms of supply and demand, not only at the Italian national level but also at the regional level. This research provides an additional feature with respect to previous research which was modelling aspects of the epidemic and did not include other factors which could play a hidden role in the evolution of the pandemic. 61 On the other hand, Increasing the information level using the traditional models requires major modelling development. It entails greater complexity in the systemic implementation in a real-life scenario such as the case of the ECO4CO platform. In this optics, AI offers some flexibility and adaptability to developing situations. It allows us to perform predictions with limited effective knowledge of the mathematical equations driving the pandemic dynamics, particularly in the emergence of new variants.
In general, the present study's findings have shown good predictive values for the parameters of interest. However, with regard to the regional risk classification colour code, it was observed that the performances dropped for a few regions with lower population density such as Sardinia, while the model performed well globally and in most regions of Italy (80%). Additional work can be performed to improve and derive models according to the population density. Moreover, accounting for restrictive measures such as blocking, quarantine, and travel restrictions could improve the accuracy of the prediction. In addition, vaccination data could be incorporated into forecast models, significantly improving forecast performance. Accordingly, a line of future research could be to extend the proposed prediction models with exogenous variables such as those on vaccination and restrictions. 61
Regarding attendance in the emergency rooms, it was observed that it was difficult to assess the trends for small structures with greater accuracy. However, it was found that the impact of these structures is minimal in the admittance of patients at the regional level according to demographics. While the inherent impact of the predictions for these small structures may have important relative variations; in terms of absolute values, these variations are in the order of few patients and can be acceptable if adequate contingencies are taken.
The present research represents a fraction of the proposed DSS for the management of the COVID-19 response, as it covers the medical logistic aspect of the platform. The ECO4CO platform, as a whole, offers the possibility to obtain information on people's mobility and sentiment analysis thanks to systematic data collection from several sources, which entails the generation of specific alarms when thresholds are crossed.
The success of the application and similar systems is bound to several factors, which are linked to technical and human aspects such as the availability of a large quantity of official medical data from online platforms and in formats and frequencies that facilitates periodic acquisition and processing; the use of technological paradigms and development practises that allow easy integration of online services, updates and scalability and also the use of powerful and dedicated libraries for Machine Learning. Even if individual privacy is guaranteed, failure to adequately address the reuse of personal data and the digital divide problem will lead to digital epidemiology tools that undermine equity, fairness, and public trust. In contrast, a broader ethical and data governance approach, and meaningful public engagement will encourage adopting these technologies and using personal data for public health research, thereby increasing their power to address epidemics. 62
On the other hand, a good synergy has been put in place between participants from different disciplines such as engineers and medical doctors. In fact, it has been argued that the lack of interdisciplinary cooperation was one of the weaknesses of research in this area. AI techniques for COVID-19 diagnosis and prediction require the integration of several different disciplines, such as computer science, medical imaging, and physicians in general. Cooperation among researchers from different disciplines is key to combining and integrating various knowledge to be more impactful in the fight against COVID-19. 61
During the COVID-19 pandemic, numerous websites and web applications have been created to offer free access to COVID-19 data from a variety of sources, but more work remains to be done in order to fully enable an efficient response system in real-time and near-real-time. 23 The present DSS system allows to tackle such limitation not only by providing the analyses and predictions as tools to enable decision making, but also by contributing to the creation of extensive DBs inclusive of a wider set of key parameters and factors that play a role in the understanding of the evolution of the pandemic. The versatility of the platform and the design paradigms used to allow extension of services and scalability offer possibilities for extending this application to possible health emergencies that may arise in the future. New research directions can be taken from this study by providing more extensive prediction models and incorporating additional information related to socio-economical and cultural factors. In addition, new research on the application of AI can be more pertinent in developing the logics for decision-making and providing suggestions to the health authorities.
Conclusions
The ECO4CO DSS was developed to enable near-real-time analyses of the COVID-19 disease's epidemiological spread and trends concerning geographic distribution (from the national level to district detail). Its development involved a multidisciplinary collaboration between clinical, geographical and engineering teams and scientists with a broad range of specialisations.
The study focused on the LP sub-service, which was designed to allow the clinical and medical-related decision-making personnel to monitor, manage, and predict medical equipment logistic needs and help the scheduling of supplies for medical centres across the country, according to newly identified potential clusters.
The sub-service relies on identifying warnings related to the regional risk classification colour code, the access to the Lazio region's emergency rooms, and forecast of medical stock needs at the regional level.
The prediction of these features was made using Machine Learning algorithms and an evaluation of their outputs was performed during a pilot phase where several metrics were applied according to the type of prediction problem (e.g., time series forecast and classification).
The results obtained demonstrate that the regional risk classification colour code, based on the forecast of the number of new positives, non-critical hospitalised patients and ICU patients, show globally high scores, except for one region, which was affected by the presence of several false positives.
The prediction of the emergency room utilisation for the Lazio region yielded a very low RMSE, which shows the model's efficiency, especially for the major hospitals of the Lazio region, which admit about 90% of the region's patients.
The prediction of the medicinal consumption for the regions of Lazio and Piemonte has yielded a low RMSPE of 16%.
In the context of the pilot phase, the ECO4CO's LP subservice has demonstrated an operational capability in providing useful tools for decision support activities in the case of the COVID-19 pandemic. The diversity and extent of open-access data from the official sources provide an opportunity for continuously improving the models and providing new services for the clinical and decision-making personnel in the management of the pandemic state, while enhancing the readiness level to tackle epidemiological emergencies that may arise in the future.
The development of DSS systems enabling accurate forecasting of the evolution of new cases and drug utilisation will enable the resulting excess demand throughout the supply chain to be managed more effectively. The progression of COVID-19 across countries has shown how it has led to fundamental changes in the need for care and citizens’ behaviours more generally. Such changes put supply chains under strain. Therefore, forecasting during a pandemic becomes essential for effective government decision-making, managing supply chain resources, and for informing tough policy decisions such as, for example, imposing a lockdown. However, successful analysis and forecasting depend crucially on the availability of rich, real-time data sources.
Supplemental Material
Supplemental material, sj-docx-1-dhj-10.1177_20552076231185475 for A predictive decision support system for coronavirus disease 2019 response management and medical logistic planning by Sofiane Atek, Filippo Bianchini, Corrado De Vito, Vincenzo Cardinale, Simone Novelli, Cristiano Pesaresi, Marco Eugeni, Massimo Mecella, Antonello Rescio, Luca Petronzio, Aldo Vincenzi, Pasquale Pistillo, Gianfranco Giusto, Giorgio Pasquali, Domenico Alvaro, Paolo Villari, Marco Mancini and Paolo Gaudenzi in DIGITAL HEALTH
Acknowledgment
The authors would like to thank all the participant staff for the ECO4CO project from Telespazio S.p.A, e-GEOS S.p.A, Leonardo S.p.A, LINKS Foundation (formerly ITHACA), CherryData S.r.l and Sapienza University of Rome. The authors would like to thank ESA for its support to this project.
Footnotes
Contributorship: Project supervision was contributed by PG, MC, PV, DA, AR, LP, AV and PP. Method development, design, implementation and results data collection were contributed by FB, AR, PP, GG and GP. Consultancy was handled by MM and ME. Results evaluation, analyses and interpretation were done by CDV, VC, CP and SA. Statistical analyses and performance evaluation were handled by SA. First draft was prepared by SA. Editing and critical review were handled by FB, CDV, SN and CP. Review and approval of manuscript were handled by all authors.
The authors declared no potential conflicts of interest with respect to the research, authorship, and/or publication of this article.
Ethical Approval: Ethical approval was not sought for the present study because it used solely open-type information freely available in the public domain.
Funding: The present paper results from the project ‘Earth Cognitive System 4 COVID-19 (ECO4CO)’ co-funded by the European Space Agency (ESA contract No 4000133199/20/NL/AF) and developed in collaboration by Telespazio S.p.A, e-GEOS S.p.A, Leonardo S.p.A, LINKS Foundation (formerly ITHACA), CherryData S.r.l and Sapienza University of Rome.
Patient Consent Statements: The authors confirm that no Patient Consent Statement was required during the study because no subject or patient was involved in the present study as the study relied only on open-type information freely available in the public domain.
Guarantor: CDV.
ORCID iD: Sofiane Atek https://orcid.org/0000-0001-5213-5343
Supplemental material: Supplementary material for this article is available online.
References
- 1.World Health Organization. Coronavirus disease 2019 (COVID-19) situation report 51, https://www.who.int/docs/default-source/coronaviruse/situation-reports/20200311-sitrep-51-covid-19.pdf?sfvrsn=1ba62e57_10 (2020, accessed 07 February 2022).
- 2.World Health Organization. An unprecedented challenge: Italy’s first response to COVID-19, 2020. https://www.dors.it/documentazione/testo/202005/COVID-19-Italy-response.pdf, (2020, accessed 21 September 2021).
- 3.Angeloni A, Farina A, Ialongo C, et al. Monitoring the infection of SARS-CoV-2 and the development of diagnostic tools. J-READING (J Res Didact Geogr) 2020; 2: 67–77. [Google Scholar]
- 4.Aliyu AA. Public health ethics and the COVID-19 pandemic. Ann Afr Med 2021; 20: 157–163. [DOI] [PMC free article] [PubMed] [Google Scholar]
- 5.Pesaresi C, Pavia D, De Vito C. Three geotechnological proposals to tackle health emergencies and the monitoring of infectious diseases. Inputs from the COVID-19 pandemic for future preparedness. Bollettino della ASSOCIAZIONE ITALIANA di CARTOGRAFIA 2020; 170: 58–75. [Google Scholar]
- 6.Pesaresi C. A geographical and crosscutting look at the COVID-19 pandemic in an international framework. Introduction. J-READING (J Res Didact Geogr) 2020; 2: 13–19. [Google Scholar]
- 7.Chams N, Chams S, Badran R, , et al. COVID-19: a multidisciplinary review. Front Public Health 2020 Jul 29; 8: 83. [DOI] [PMC free article] [PubMed] [Google Scholar]
- 8.Stasi C, Fallani S, Voller F, et al. Treatment for COVID-19: an overview. Eur J Pharmacol 2020 Dec 15; 889: 173644. [DOI] [PMC free article] [PubMed] [Google Scholar]
- 9.Grekousis G, Wang R, Liu Y. Mapping the geodemographics of racial, economic, health, and COVID-19 deaths inequalities in the conterminous US. Appl Geogr 2021 Oct; 135: 102558. [DOI] [PMC free article] [PubMed] [Google Scholar]
- 10.Bertazzoni G, Ruggiero M, Bertazzoni B. Spatial inequalities of COVID-19 in Italy. J-READING (J Res Didact Geogr) 2020; 1: 207–212. [Google Scholar]
- 11.International Health Regulations, Third edition, World Health Organization, (2005), 75.
- 12.Yakovlev S, Bazilevych K, Chumachenko D, et al. The concept of developing a decision support system for the epidemic morbidity control. CEUR Workshop Proc 2020; 2753: 265–274. [Google Scholar]
- 13.Chaudhry R, Dranitsaris G, Mubashir T, et al. A country level analysis measuring the impact of government actions, country preparedness and socioeconomic factors on COVID-19 mortality and related health outcomes. EClinicalMedicine 2020; 25: 100464. ISSN 2589-5370, [DOI] [PMC free article] [PubMed] [Google Scholar]
- 14.Iacus SM, Natale F, Santamaria C, et al. Estimating and projecting air passenger traffic during the COVID-19 coronavirus outbreak and its socio-economic impact. Saf Sci 2020 Sep; 129: 104791. [DOI] [PMC free article] [PubMed] [Google Scholar]
- 15.Atek S, Pesaresi C, Eugeni M, et al. An Earth Observation Cognitive System in Response to Sars-COVID-19 Emergency. In: Proceedings of the International Astronautical Congress – IAC 2021, Dubai, United Arab Emirates, 25-29 October 2021. Paper code: 64144, ISSN 1995-6258. [Google Scholar]
- 16.Yousefinaghani S, Dara RA, Poljak Z, et al. A decision support framework for prediction of avian influenza. Sci Rep 2020 Nov 4; 10: 19011. [DOI] [PMC free article] [PubMed] [Google Scholar]
- 17.Chung K, Boutaba R, Hariri S. Knowledge based decision support system. Inf Technol Manag 2016; 17: –3. [Google Scholar]
- 18.Werner PA, Kęsik-Brodacka M, Nowak K, et al. Modeling the spatial and temporal spread of COVID-19 in Poland based on a spatial interaction model. ISPRS Int J Geoinf 2022; 11: 21. [Google Scholar]
- 19.Samany NN, Liu H, Aghataher R, et al. Ten GIS-based solutions for managing and controlling COVID-19 pandemic outbreak. SN Comput Sci 2022; 3: 69. [DOI] [PMC free article] [PubMed] [Google Scholar]
- 20.Lei Z, Lim MK, Cui Let al. et al. Modelling of risk transmission and control strategy in the transnational supply chain. Int J Prod Res 2021; 59: 148–167. [Google Scholar]
- 21.Sawik T. Stochastic optimization of supply chain resilience under ripple effect: a COVID-19 pandemic related study. Omega (Westport) 2022; 109: 102596 [Google Scholar]
- 22.Atek S, Pesaresi C, Eugeni M, et al. A geospatial artificial intelligence and satellite-based earth observation cognitive system in response to COVID-19 emergency. Acta Astronaut 2022. ISSN 0094-5765, 197. 10.1016/j.actaastro.2022.05.013 [DOI] [PMC free article] [PubMed] [Google Scholar]
- 23.Pesaresi C, Atek S, De Vito C, et al. The ECO4CO project among retrospective data, improving of algorithms, predictive hypothesis and future perspectives to tackle health emergencies. J-READING (J Res Didact Geogr) 2022; 1: 27–48. [Google Scholar]
- 24.European Space Agency, Management Requirements for ARTES 4.0 Downstream Applications Demonstration Projects, Appendix 3 to Contract, Reference: ESA-TIAA-PR-2020-2115, Issue/Revision1.1, Date of Issue15/01/2021, https://business.esa.int/documents (2021, accessed 20 July 2021).
- 25.Kamel Boulos MN, Peng G, VoPham T. An overview of GeoAI applications in health and healthcare. Int J Health Geogr 2019 May 2; 18: 7. [DOI] [PMC free article] [PubMed] [Google Scholar]
- 26.Ahuja M, Singh J, Nica V. Web crawler: extracting the web data. Int J Comput Trends Technol 2014; 13: 132–137. [Google Scholar]
- 27.Cervone G, Sava E, Huang Q, et al. Using Twitter for tasking remote-sensing data collection and damage assessment: 2013 boulder flood case study. Int J Remote Sens 2016; 37: 100–124. [Google Scholar]
- 28.Froidevaux A, Julier A, Lifschitz A, et al. Vehicle detection and counting from VHR satellite images: efforts and open issues. IGARSS 2020 – 2020 IEEE Int Geosci Remote Sens Symp 2020: 256–259. doi: 10.1109/IGARSS39084.2020.9323827 [DOI] [Google Scholar]
- 29.Zambanini S, Loghin AM, Pfeifer N, et al. Detection of parking cars in stereo satellite images. Remote Sens 2020; 12: 2170. [Google Scholar]
- 30.Atek S, Pesaresi C, Eugeni M, et al. “Satellite-based Earth Cognitive Decision Support System for COVID-19 Pandemic Management”. In: IAC 2022 Congress Proceedings, 73rd International Astronautical Congress (IAC), Paris, France 18-22 September 2022. Paper code: 73622. [Google Scholar]
- 31.Karaarslan E, Aydın D. An artificial intelligence–based decision support and resource management system for COVID-19 pandemic. Data Sci COVID-19 2021; 12: 25–49. doi: 10.1016/B978-0-12-824536-1.00029-0 [DOI] [Google Scholar]
- 32.Vytla V, Ramakuri SK, Peddi A, et al. Mathematical models for predicting COVID-19 pandemic: a review. J Phys Conf Ser 2021; 1797. 10.1088/1742-6596/1797/1/012009 [DOI] [Google Scholar]
- 33.Wang H, Jia S, Li Z, et al. A comprehensive review of artificial intelligence in prevention and treatment of COVID-19 pandemic. Front Genet 2022 Apr 26; 13: 845305. PMID: 35559010; PMCID: PMC9086537. [DOI] [PMC free article] [PubMed] [Google Scholar]
- 34.IHME COVID-19 Forecasting Team. Modeling COVID-19 scenarios for the United States. Nat Med 2021 Jan; 27: 94–105. Epub 2020 Oct 23. Erratum in: Nat Med. 2020 Nov 27; PMID: 33097835; PMCID: PMC7806509. [DOI] [PMC free article] [PubMed] [Google Scholar]
- 35.Kuvvetli Y, Deveci M, Paksoy Tet al. et al. A predictive analytics model for COVID-19 pandemic using artificial neural networks. Decis Anal J 2021 Nov; 1: 100007. Epub 2021 Oct 30. PMCID: PMC8556691. [Google Scholar]
- 36.Kolozsvári LR, Bérczes T, Hajdu A, et al. Predicting the epidemic curve of the coronavirus (SARS-CoV-2) disease (COVID-19) using artificial intelligence: an application on the first and second waves. Inform Med Unlocked 2021; 25: 100691. Epub 2021 Aug 8. PMID: 34395821; PMCID: PMC8349399. [DOI] [PMC free article] [PubMed] [Google Scholar]
- 37.Yang Z, Zeng Z, Wang K, et al. Modified SEIR and AI prediction of the epidemics trend of COVID-19 in China under public health interventions. J Thorac Dis 2020; 12: 165. [DOI] [PMC free article] [PubMed] [Google Scholar]
- 38.Pourhomayoun M and Shakibi M. Predicting mortality risk in patients with COVID-19 using machine learning to help medical decision-making. Smart Health (Amst) 2021 Apr;20: 100178. doi: 10.1016/j.smhl.2020.100178. Epub 2021 Jan 16. PMID: 33521226; PMCID: PMC 7832156. [DOI] [PMC free article] [PubMed] [Google Scholar]
- 39.Davenport T, Kalakota R. The potential for artificial intelligence in healthcare. Future Healthc J 2019 Jun; 6: 94–98. [DOI] [PMC free article] [PubMed] [Google Scholar]
- 40.Chen G. A gentle tutorial of recurrent neural network with error backpropagation. ArXiv abs/1610.02583 2016. [Google Scholar]
- 41.Salehinejad H, Baarbe J, Sankar S, et al. Recent advances in recurrent neural networks. ArXiv 2018. ArXiv: abs/1801.01078. https://arxiv.org/abs/1801.01078 [Google Scholar]
- 42.Bianchini M, Maggini M, Jain LC. Handbook on Neural Information Processing. Intelligent Systems Reference Library 49, Springer 2013, ISBN 978-3-642-36656-7.
- 43.Guo J. Backpropagation through time. In: Unpubl. ms. Harbin Institute of Technology, 2013. [Google Scholar]
- 44.Różycki I, Wolszleger A. Comparison of Neural Network and KNN classifiers, for recognizing hand-written digits. In: Proceedings of the 5th Symposium for Young Scientists in Technology, Engineering and Mathematics (SYSTEM 2020), Vol-2694, pp. 16–21. [Google Scholar]
- 45.Chen YQ, Damper RI, Nixon MS. On neural-network implementations of k-nearest neighbor pattern classifiers. Circuits and systems I: fundamental theory and applications. IEEE Trans Circuits Syst I, Fundam Theory Appl July 1997; 44: 622–629. [Google Scholar]
- 46.Schneider A, Hommel G, Blettner M. Linear regression analysis: part 14 of a series on evaluation of scientific publications. Dtsch Arztebl Int 2010 Nov; 107: 776–782. Epub 2010 Nov 5. PMID: 21116397; PMCID: PMC2992018. [DOI] [PMC free article] [PubMed] [Google Scholar]
- 47.Maulud DH, Abdulazeez AM. A review on linear regression comprehensive in machine learning. J Appl Sci Technol Trends 2020; 1: 140–147. [Google Scholar]
- 48.Malik YS, Sircar S, Bhat S, et al. How artificial intelligence may help the COVID-19 pandemic: pitfalls and lessons for the future. Rev Med Virol 2021 Sep; 31: 1–11. Epub 2020 Dec 19. [DOI] [PMC free article] [PubMed] [Google Scholar]
- 49.Italian Ministry of Economic Development. https://www.mise.gov.it/index.php/it/open-data/cosa-sono-gli-open-data (Accessed 08 February 2022).
- 50.Lazio region website. https://dati.lazio.it/catalog/dataset/pronto-soccorso-accessi-in-tempo-reale. (Accessed 08 February 2022).
- 51.Italian Ministery of Health. ASL-Municipalities and resident population correspondences - year 2020. https://www.dati.salute.gov.it/dati/dettaglioDataset.jsp?menu=dati&idPag=3 (Accessed 09/11/2022)
- 52.Italian Medicines Agency (AIFA) website. https://www.aifa.gov.it/en/open-data (Accessed 08 February 2022).
- 53.Data respository of COVID-19 published by the Italian National Civil Protection, https://github.com/pcm-dpc/COVID-19 (Accessed 08 February 2022).
- 54.Italian National Agency for Regional Health Services (AGENAS) website, https://www.agenas.gov.it/agenas/l-agenzia (Accessed 15/02/2022).
- 55.The Italian National Institute of Statistics. http://dati.istat.it/Index.aspx?DataSetCode=DCIS_POPRES1, (Accessed 09/11/2022).
- 56.Tohka J, Van Gils M. Evaluation of machine learning algorithms for health and wellness applications: a tutorial. Comput Biol Med 2021 May; 132: 104324. [DOI] [PubMed] [Google Scholar]
- 57.Mukaka M. Statistics corner: a guide to appropriate use of correlation coefficient in medical research. Malawi Med J 2012 Sep; 24: 69–71. [PMC free article] [PubMed] [Google Scholar]
- 58.Naudé W. Artificial intelligence vs COVID-19: limitations, constraints and pitfalls. AI & Soc 2020; 35: 761–765. [DOI] [PMC free article] [PubMed] [Google Scholar]
- 59.Barmparis GD, Tsironis GP. Estimating the infection horizon of COVID-19 in eight countries with a data-driven approach. Chaos Solitons Fractals. 2020 Jun;135:109842. doi: 10.1016/j.chaos.2020.109842. Epub 2020 Apr 27. PMID: 32341627; PMCID: PMC7183990. [DOI] [PMC free article] [PubMed]
- 60.Takele R. Stochastic modelling for predicting COVID-19 prevalence in East Africa countries. Infect Dis Model 2020; 5: 598–607. Epub 2020 Aug 18. PMID: 32838091; PMCID: PMC7434383. [DOI] [PMC free article] [PubMed] [Google Scholar]
- 61.Comito C, Pizzuti C. Artificial intelligence for forecasting and diagnosing COVID-19 pandemic: a focused review. Artif Intell Med 2022 Jun; 128: 102286. [DOI] [PMC free article] [PubMed] [Google Scholar]
- 62.Ferretti A, Vayena E. In the shadow of privacy: overlooked ethical concerns in COVID-19 digital epidemiology. Epidemics 2022 Nov 4; 41: 100652. [DOI] [PMC free article] [PubMed] [Google Scholar]
Associated Data
This section collects any data citations, data availability statements, or supplementary materials included in this article.
Supplementary Materials
Supplemental material, sj-docx-1-dhj-10.1177_20552076231185475 for A predictive decision support system for coronavirus disease 2019 response management and medical logistic planning by Sofiane Atek, Filippo Bianchini, Corrado De Vito, Vincenzo Cardinale, Simone Novelli, Cristiano Pesaresi, Marco Eugeni, Massimo Mecella, Antonello Rescio, Luca Petronzio, Aldo Vincenzi, Pasquale Pistillo, Gianfranco Giusto, Giorgio Pasquali, Domenico Alvaro, Paolo Villari, Marco Mancini and Paolo Gaudenzi in DIGITAL HEALTH


