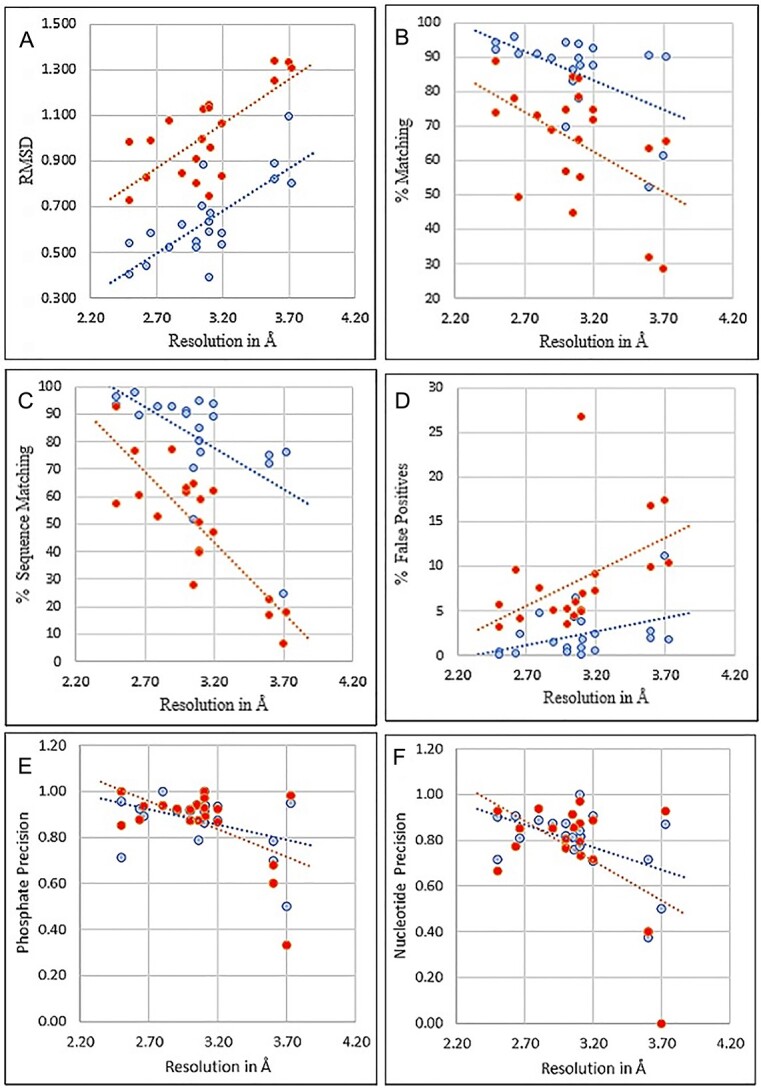
Figure 5.

Amino acid and Nucleotide modeling comparison of 20 experimental protein-RNA/DNA cryo-EM maps. DeepTracer models are blue and Phenix models are red. The dotted line represents the trend for each pipeline. (A) RMSD for Cα in amino acid structures. (B) Matching % shows the proportion of residues that have a matching residue, within 3 Å. (C) Sequence matching % shows if the predicted amino acid has the same type of amino acid. (D) False positive % predicted from deposited residues. (E) Nucleotide prediction if the phosphate atom is within 1.5 Å. (F) Nucleotide prediction if the phosphate and C1’ atom are within 1.5 and 1.0 Å, respectively. For subfigure f, EMD-11550 and EMD-24428 shared the same Nucleotide-CC score (0.4), their phosphate scores were different (0.68 and 0.6).
