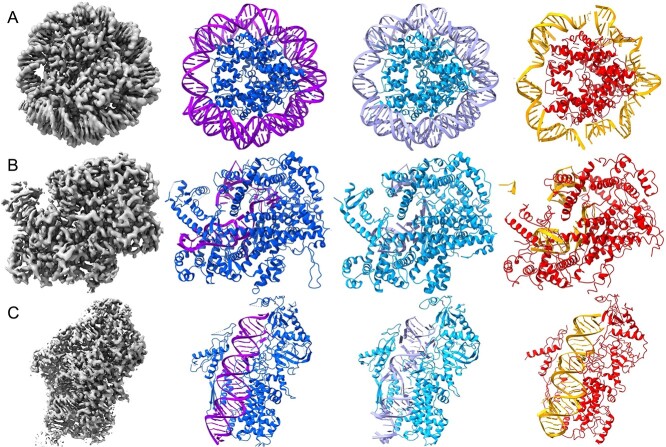
Figure 6.
A visual comparison of DeepTracer and Phenix models from experimental protein-RNA/DNA cryo-EM maps. There are three cryo-EM maps that go through each pipeline in order to predict the structure. Each model is colored differently, DeepTracer uses light blue for amino acids and mauve for nucleotides, Phenix uses red for amino acids and orange for nucleotides, and the deposited model uses blue for amino acids and purple for nucleotides. (A) Result of DNA model EMD-12900. Both the DNA and amino acids appear more complete in the DeepTracer pipeline. (B) Result of RNA model EMD-6777. Both maps had issues tracking the single stranded nucleotides. Additionally, Phenix also had a few false positive nucleotides. (C) Result of RNA model EMD-31963. Phenix had a better prediction for the double helix RNA structure, but DeepTracer did better with the amino acid structure.

