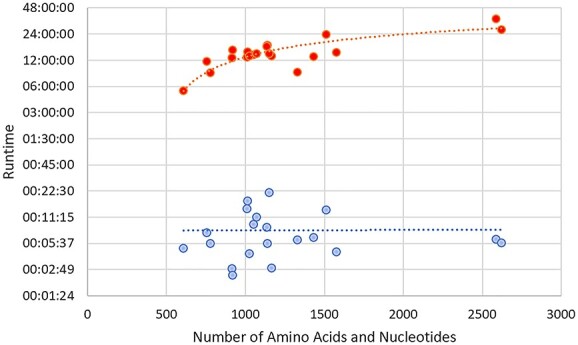
Figure 7.

Computational runtime comparison of 20 experimental protein-RNA/DNA maps. The dotted lines represent the trend for each method. The times are shown on a logarithmic scale and combine the runtime totals of amino acid and nucleotide methods. DeepTracer models are blue and Phenix models are red.
