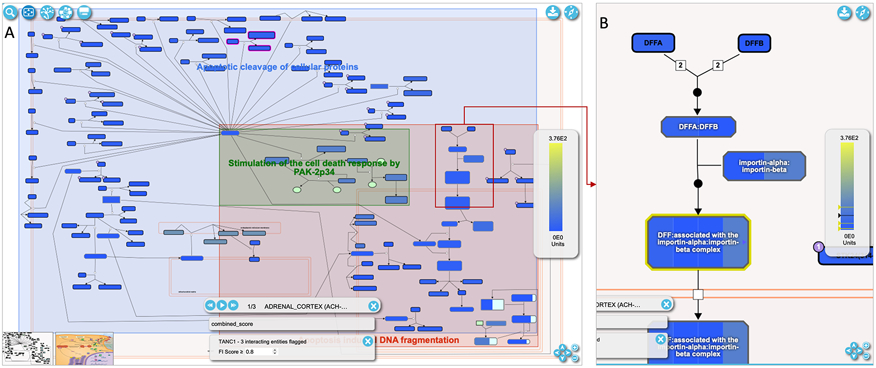
Figure 18.
A. Tissue specific expression data overlaid on the diagram view of the “Apoptotic execution phase” pathway, which is accessible via the link, https://idg.reactome.org/PathwayBrowser/#/R-HSA-75153&PATH=R-HSA-5357801,R-HSA-109581&FLG=TANC1&FLGINT&DSKEYS=0&SIGCUTOFF=0.8&FLGFDR=0.05. B. A zoomed-in view of the pathway diagram highlights a reaction with complexes annotated. These complexes have annotated proteins with their expression displayed in segments (e.g. DFF:associated with the importin-alpha:importin-beta complex having four segments corresponding to four proteins, DFFA, DFFB, KPNA1, KPNB1).

