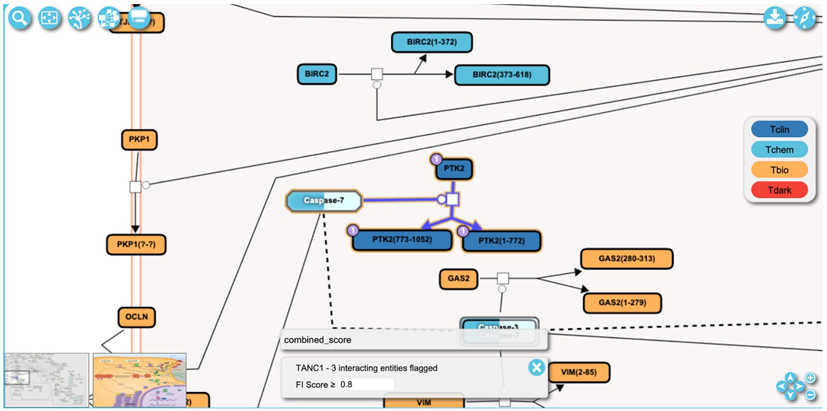
Figure 26.
A zoomed in view of the pathway diagram shows overlaid drug interactions as purple circles at the top-left corner of entities. The number indicates the number of drugs that can interact with the entity. The reaction highlighted in this diagram is “Caspase-mediated cleavage of FADK 1” and can be accessed via https://idg.reactome.org/PathwayBrowser/#/R-HSA-75153&SEL=R-HSA-201634&PATH=R-HSA-5357801,R-HSA-109581&FLG=TANC1&FLGINT&DSKEYS=0&SIGCUTOFF=0.8&FLGFDR=0.05.

