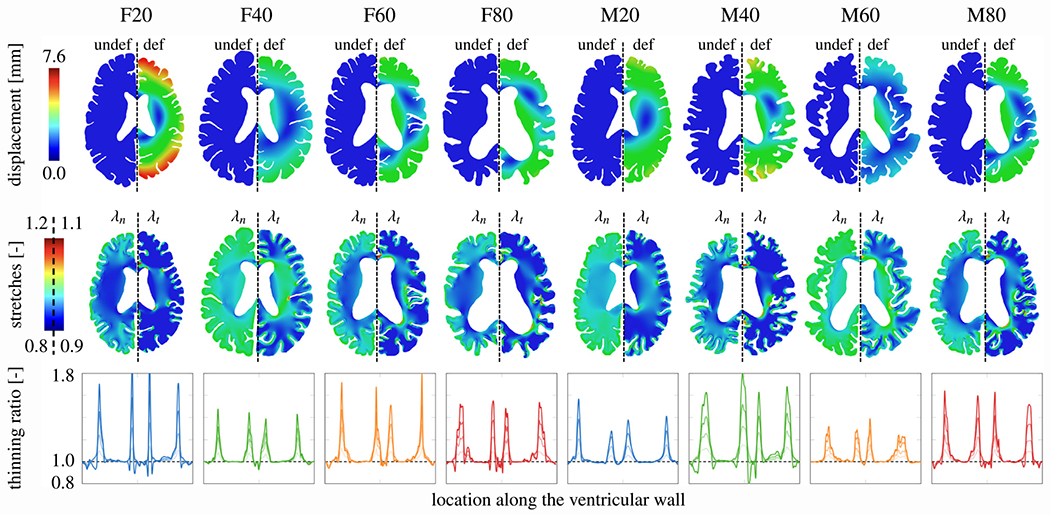
Fig. 3.

Atrophy-related simulation results. For each model, we show the displacement magnitude field for the undeformed (left hemisphere) and deformed configuration (right hemisphere) to visualize ventricular enlargement (top row). We interpret brain deformations with respect to normal (left hemisphere) and tangential stretch (right hemisphere) in the tissue based on direction vectors obtained from a Laplacian problem a priori. We use these fields to calculate the thinning ratio which we exclusively evaluate along the ventricular wall [25,27] (third row). In the line plots, the solid line in each plot indicates the thinning ratio at 20% ventricular enlargement.
