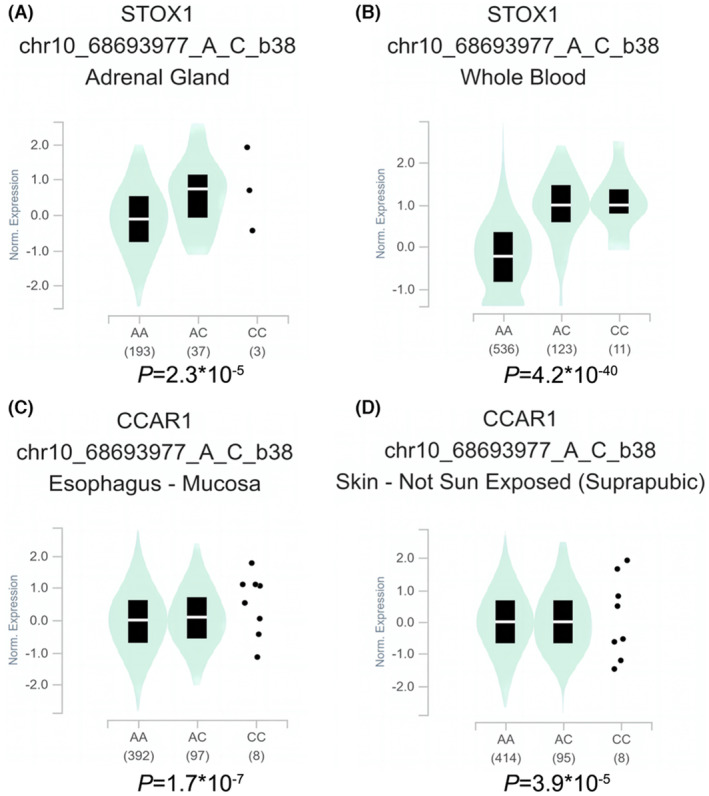
FIGURE 2.

eQTL analysis shows the effect of TET1 rs12781492 A > C on surrounding gene expression. (A, B) In the adrenal gland (p = 2.3 × 10⁻⁵) and whole blood (p = 4.2 × 10−40), rs12781492 C was significantly associated with increased STOX1 mRNA expression. (C, D) In the oesophageal mucosa (p = 1.7 × 10⁻⁷) and skin (p = 3.9 × 10⁻⁵), rs12781492 C was significantly associated with an increase in CCAR1 mRNA expression. Violin diagrams were obtained through the GTEx official website (https://www.gtexportal.org/home/).
