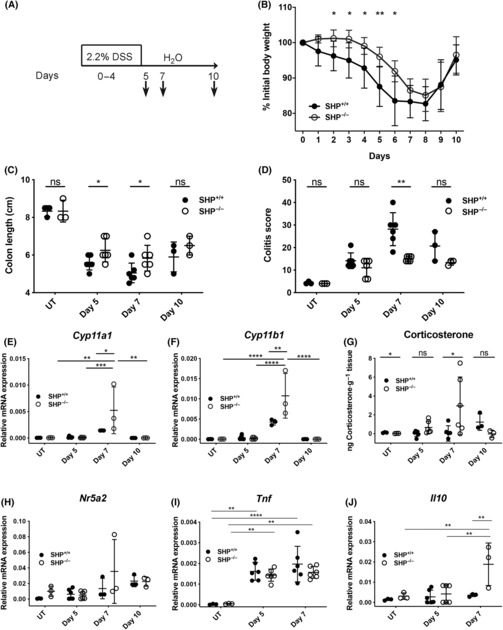
Fig. 4.

Effect of Shp on acute colitis and intestinal glucocorticoid synthesis. (A) Scheme of acute colitis induction. (B) Weight loss curve of Shp+/+ and Shp−/− mice during acute DSS colitis (n = 3–6 mice per group and time point. Mean values ± SD). (C, D) Colon shortening (C) and colitis score (D) of Shp+/+ and Shp−/− mice at days 0 (UT), 5, 7 and 10 post‐DSS treatment (n = 3–6 mice per group and time point. Mean values ± SD). (E, F) Colonic Cyp11a1 (E) and Cyp11b1 (F) mRNA expression in Shp+/+ and Shp−/− mice at day 0 (UT), days 5, 7 and 10 post‐DSS treatment (n = 3–6 mice per group and time point. Mean values ± SD). (G) Ex vivo colonic corticosterone synthesis (ng·g−1 tissue) in Shp+/+ and Shp−/− mice at day 0 (UT), days 5, 7 and 10 post‐DSS treatment (n = 3–6 mice per group and time point. Mean values ± SD). (H–J) Colonic Nr5a2 (H), Tnf (I) and Il10 (J) mRNA expression in Shp+/+ and Shp−/− mice at day 0 (UT), days 5 and 7 post‐DSS treatment (n = 3–6 mice per group and time point. Mean values ± SD). Unpaired Student's t‐test (B–D, G), two‐way ANOVA followed by Tukey's multiple comparison test (E, F, H–J), *P < 0.05, **P < 0.01, ***P < 0.001, ****P < 0.0001, ns: not significant. Typical experiments of n = 3 are shown.
