Fig. 7.

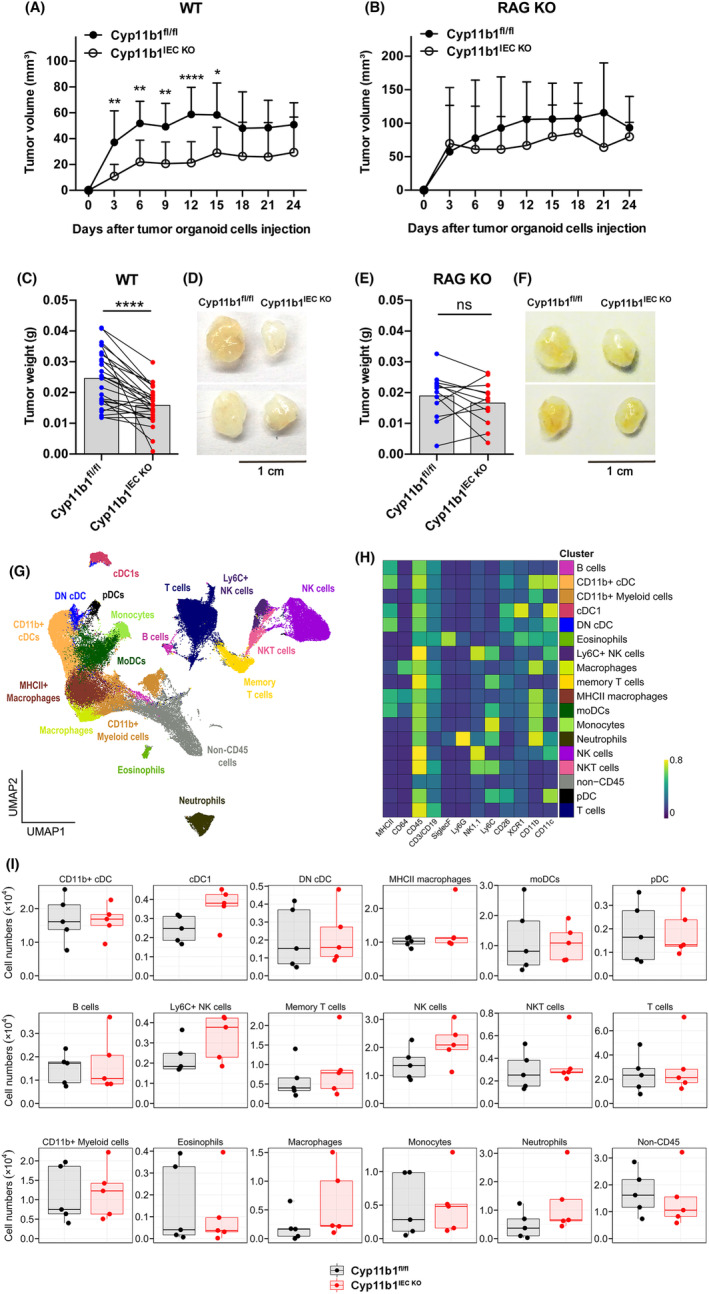
Role of tumour glucocorticoid synthesis in immune evasion of transplanted tumour organoids. Control (Cyp11b1fl/fl) and Cyp11b1IEC KO tumour organoids were transplanted into immunocompetent C57Bl/6 wild‐type recipients (WT) (A) or lymphopenic Rag1‐deficient mice (RAG KO) (B). (A, B) Tumour growth of transplanted tumours. Mean values ± SD of n = 12–26 mice per group are shown. (C, E) Mean values ± SD of tumour weight of isolated Cyp11b1fl/fl and Cyp11b1IEC KO tumours at day 12 post transplantation into wild‐type recipient mice (C) (n = 26 mice per group) or Rag1‐deficient mice (E) (n = 12 mice per group). Data points of tumours from the same recipient mice have been connected by lines. Unpaired Student's t‐test. ns not significant, *P < 0.05, **P < 0.01, ***P < 0.001, ****P < 0.0001. Experiments have been repeated four times (A) and two times (B). (D, F) Examples of tumours isolated at day 12 post transplantation. (G–I) High‐dimensional flow cytometry analysis of tumour‐infiltrating immune cells from control (Cyp11b1fl/fl)‐ or Cyp11b1‐deficient (Cyp11b1IEC KO) tumours at day 9 post transplantation. Data represent combined samples with n = 5 mice per group. (G) UMAP plot with manually annotated FlowSOM cell clusters of 100 000 cells combined from all tumours (10 000 cells randomly sampled per tumour). (H) Heatmap with lineage marker expressions (columns) over the manually annotated FlowSOM cell clusters (rows). (I) Total cell numbers of indicated cell clusters are presented as box plots showing the 25th to 75th percentiles with whiskers indicating the range to the smallest and largest data point until the 1.5× IQR. Dots in box plots represent individual mice. Box plots with median values and lower and upper quartiles are shown. DN cDCs, double‐negative conventional dendritic cells; moDCs, monocyte‐derived dendritic cells; lineage, pDCs, plasmacytoid dendritic cells.
