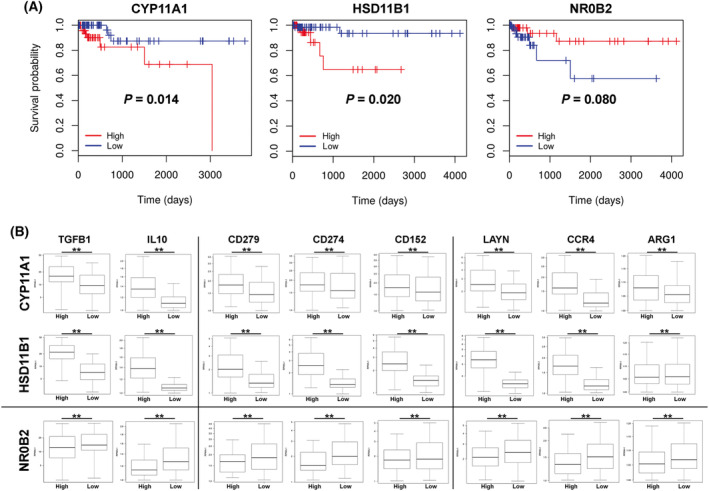
Fig. 8.

Survival curves of colon cancer patients with high or low expression of CYP11A1, HSD11B1 and NR0B2. (A) Colon cancer patients were stratified into groups of the highest or lowest quartile expression of the genes CYP11A1, HSD11B1 or NR0B2 (SHP), and survival was analysed (95 patients per group). Statistical differences (P‐values) are indicated. (B) Individual tumours from the highest or lowest quartile expression of CYP11A1, HSD11B1 and NR0B2 were analysed for the expression of genes related to immunoregulatory cytokines (TGFB1, IL10), immune checkpoints (CD279 (PD‐1), CD274 (PD1‐1L), CD152 (CTLA‐4)), and M2‐like macrophage markers (LAYN, CCR4, ARG1). The data were derived from 379 colon adenocarcinoma (COAD) samples from the TCGA database using upper (high) quartile (n = 95) versus lower (low) quartile (n = 95) expression of the given gene (CYP11A1, HSD11B1 or NR0B2) to form the groups analysed. Kaplan–Meier survival plots comparing the higher quartile versus lower quartile groups defined by expression of each gene indicated. The expression levels of immune genes are shown as the log RPKM – reads per kilobase per million mapped reads. Box plots with median values, lower and upper quartiles and minima and maxima are shown. All markers show significant differences (**P < 0.01) between high and low CYP11A1, HSD11B1 and NR0B2 expressors.
