
Fig. 2.
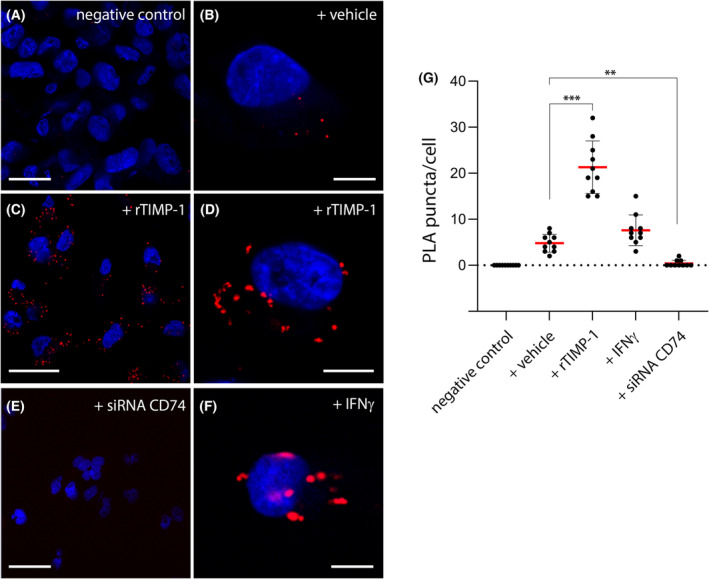
In situ proximity ligation assay (PLA) analysis of protein complexes consisting of CD74 and TIMP‐1. (A–F) The in situ PLA signal (red puncta) requires that CD74 and TIMP‐1 are in close proximity of each other (within 40 nm). (A) PLA signal was undetectable in negative control experiments, where only one antibody was incubated with the PLA probes. Anti‐CD74 was omitted in the shown experiment. (B) Under standard growth conditions, we found multiple PLA signals (red puncta). (C, D) Addition of rTIMP‐1 (5 μg·mL−1) drastically increased the number of visible PLA puncta. (E) Downregulation of CD74 with siRNA completely abolished the PLA signals. (F) Increasing expression of CD74 with IFNγ also resulted in increased number of PLA puncta. (G) Ten different regions were selected, and PLA puncta counted and normalized to cell number in each region. Results were plotted for each condition and presented as mean ± SD. Nuclei stained with DAPI dye (blue) are shown. Images were acquired across multiple z‐planes and combined. Representative images are shown for each condition. Data are representative of three independent experiments. Scale bars: (A, C, E)– 50 μm; (B, D, F)– 10 μm. ** denotes P < 0.01, and *** denotes P < 0.001. One‐way ANOVA was performed to compare the PLA puncta in MDA‐MB‐231 cells under the various conditions.