
Fig. 2.
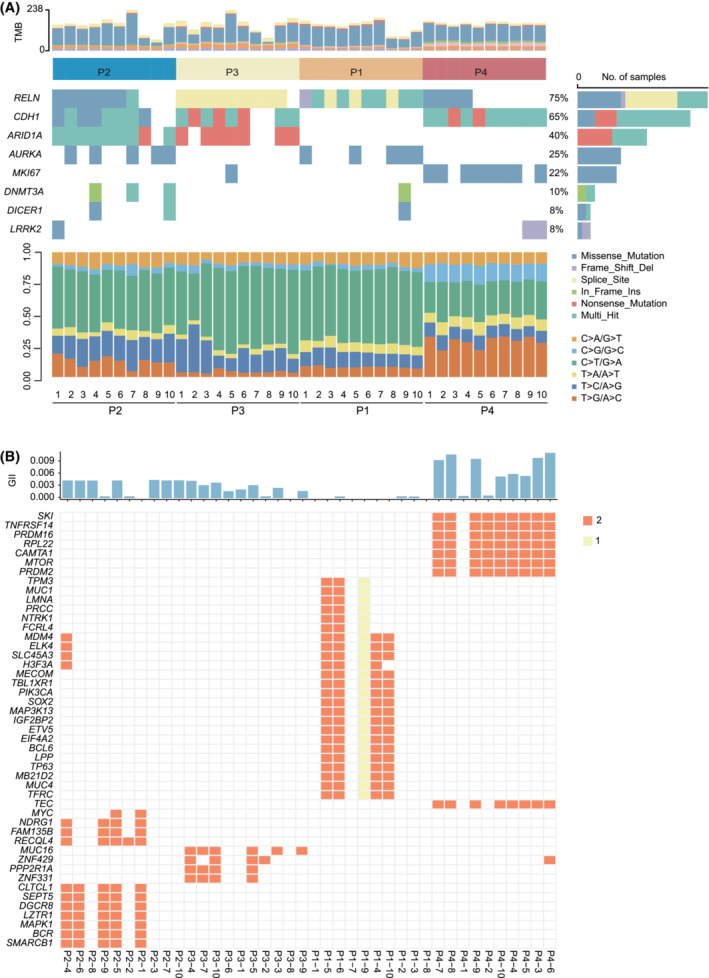
Frequently altered genes in the 40 tumor regions from 4 LP patients. (A) The mutations from the top 30 genes with the highest mutation frequency among the 40 tumor regions are shown with the mutation frequency on the left and the tumor mutation burdens (TMB) at the top (light gray for synonymous mutations and gray non‐synonymous mutations, respectively) and mutation spectrum of transitions (Ti) and transversions (Tv) in 40 tumor regions from four LP tumors on the bottom. Different types of somatic variants are indicated by different colors on the right. (B) Recurrent cancer gene with copy number variation in the four LP patients. The genomic instability index (GII) is denoted by the top barplot column.