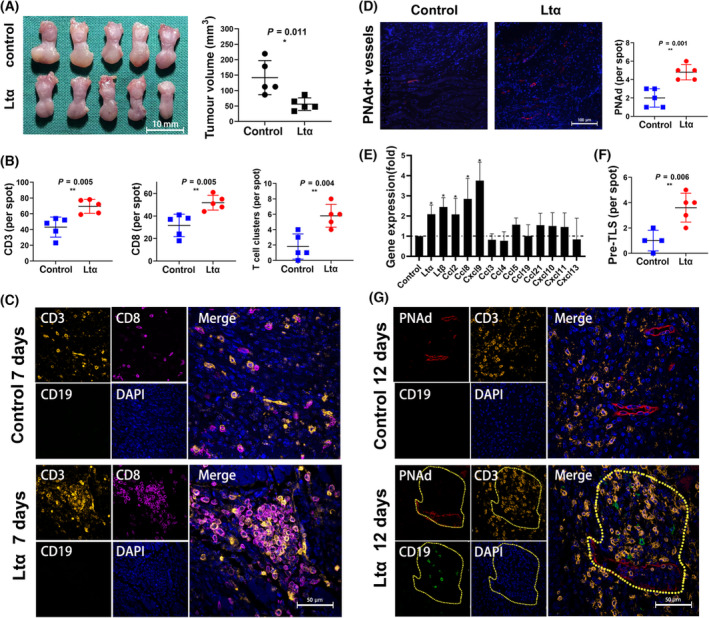
Fig. 4.

Tongue tumour‐bearing models developed by the injection of SCC7 cells whose Ltα was over expressed. (A) General views of the tongue of the mouse model. The tumour volume was compared in control group (n = 5) and Ltα group (n = 5) (scale bar: 10 mm). The error bars represent the SD of the mean. The asterisks indicate the P‐value: *< 0.05 (Student's t‐test). (B) CD3+, CD8+ cells and T‐cell clusters in control group mice (n = 5) and Ltα group mice (n = 5) on the seventh day. The error bars represent the SD of the mean. The asterisks indicate the P‐value: **< 0.01 (Student's t‐test). (C) Representative pictures of multiple immunochemical staining of CD3, CD8 and CD19 in control group mice (n = 5) and Ltα group mice (n = 5) on the seventh day (scale bar: 50 μm). (D) PNAd staining results in different groups (scale bar: 100 μm). The error bars represent the SD of the mean. The asterisks indicate the P‐value: **< 0.01 (Student's t‐test). (E) Expression of TLS related mRNA (Ltα, Ltβ, Ccl2, Ccl8, Cxcl9, Ccl3, Ccl4, Ccl5, Ccl19, Ccl21, Cxcl10, Cxcl11, Cxcl13) in tumours from Ltα group (n = 5) on the seventh day. The mRNA expression was presented relative to those from control group (n = 5) (far left). The error bars represent the SD of the mean. The asterisks indicate the P‐value: *< 0.05 (Student's t‐test). (F) Pre‐TLS (the Grade 1 TLS‐like‐structure) development in different groups. The asterisks indicate the P‐value: **< 0.01 (Student's t‐test). (G) Representative pictures of multiple immunochemical staining of CD3, CD8 and CD19 in control group mice (n = 5) and Ltα group mice (n = 5) on the 12th day (scale bar: 50 μm). The yellow border marks indicate Pre‐TLS.
