Fig. 2.

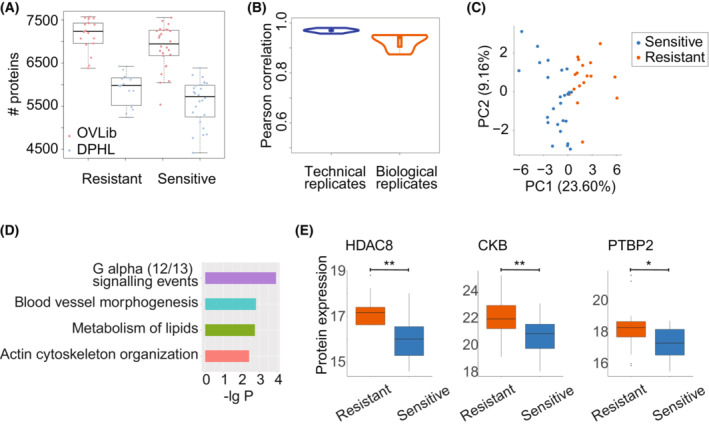
Quality control of the proteome against OVLib and its application. (A) The comparison of the unique proteins identified in ovarian cancer tissues against DPHL and OVLib. The plot whiskers define outliers according to Tukey's rule (e.g., more than 1.5 times the interquartile range from the quartiles). (B) The Pearson correlation of the quantified proteins between technical replicates and biological replicates. The biological replicates represent the proteomic data obtained from different ovarian tissue samples which are dissected from the same patients, while the technical replicates represent the proteomic data that was run twice using the same peptide samples. Eight pairs of biological replicates and five pairs of technical replicates were included. (C) Unsupervised clustering by differentially expressed proteins using PCA. (D) The enriched pathways for differentially expressed proteins by metascape. (E) The protein expression of differentially expressed proteins between the sensitive and resistant groups. The P values were calculated by Student's t test. **, P value < 0.01; *, 0.01 ≤ P value < 0.05. The plot whiskers define outliers according to Tukey's rule.
