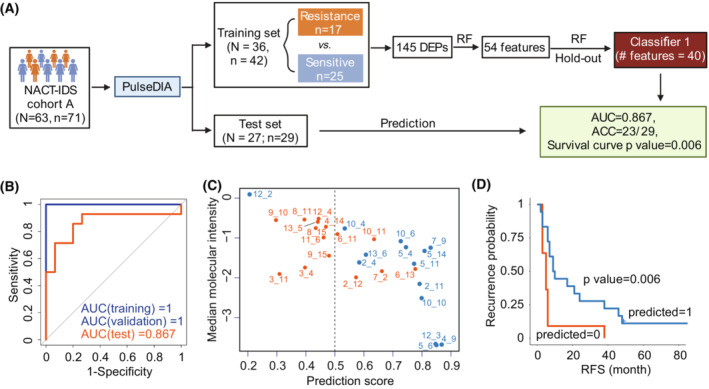
Fig. 4.

Protein classifier for predicting chemoresistance of HGSOC patients after NACT‐IDS treatment. (A) Development of a 40‐protein classifier using random forest based on PulseDIA data. RF, random forest analysis. (B) The receiver operating characteristic curves (ROCs) of training, validation set and test cohorts by the 40‐protein classifier. (C) Classification of tumors by the 40‐protein classifier in the test cohort. The orange ones were predicted chemoresistant, while the blue ones chemosensitive. (D) The Kaplan–Meier plot of the predicted groups by the 40‐protein classifier in the test cohort. The P was calculated by Log‐rank test.
