Fig. 5.

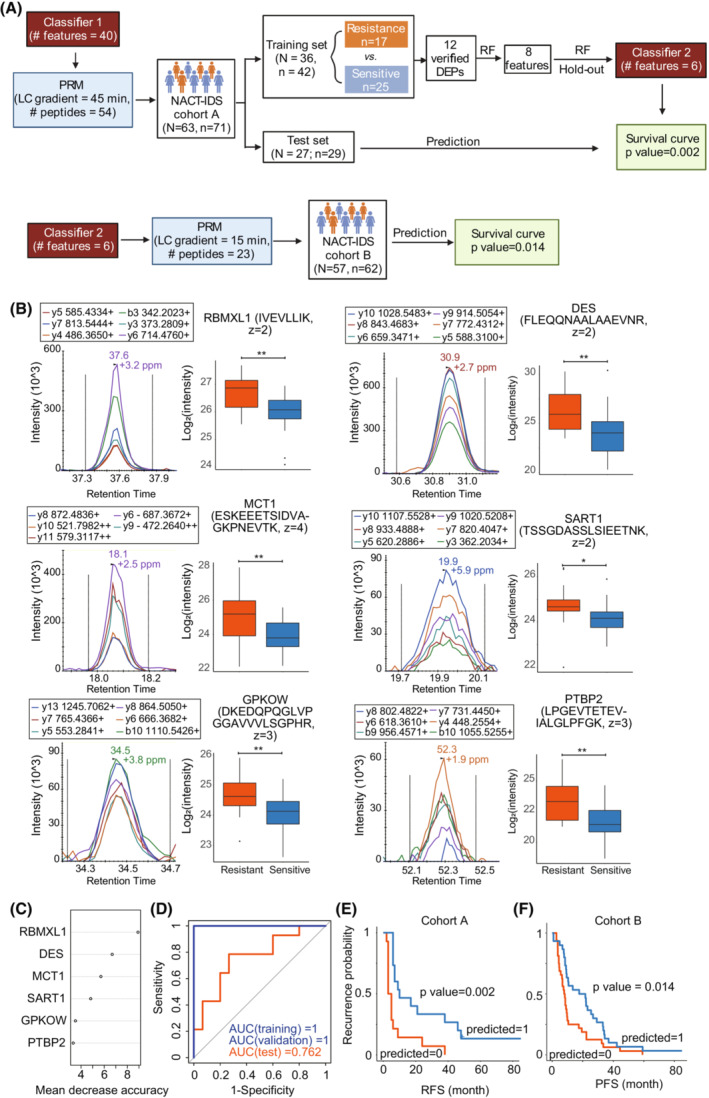
Six‐protein classifier for predicting chemoresistance of HGSOC patients after NACT‐IDS treatment. (A) Development of a six‐protein classifier using random forest based on PRM data. RF, random forest analysis. (B) The representative peak group chromatography (left) of top six features selected by RF analysis, and their expression between the resistance and sensitive groups in the training set. The P was calculated by Student's t test. **, P < 0.01; *, 0.01 ≤ P < 0.05. z represents the charge state of a peptide precursor. The plot whiskers define outliers according to Tukey's rule. (C) The rank of mean decrease accuracy of the six features. (D) The ROCs of training, validation set and test cohort by the six‐protein classifier. (E) The Kaplan–Meier plot of the predicted groups by the six‐protein classifier in the test cohort. The P was calculated by Log‐rank test. (F) The Kaplan–Meier plot of the predicted groups by the six‐protein classifier in the external validation cohort. The P was calculated by Log‐rank test.
